文章目录
- 实现
- 代码
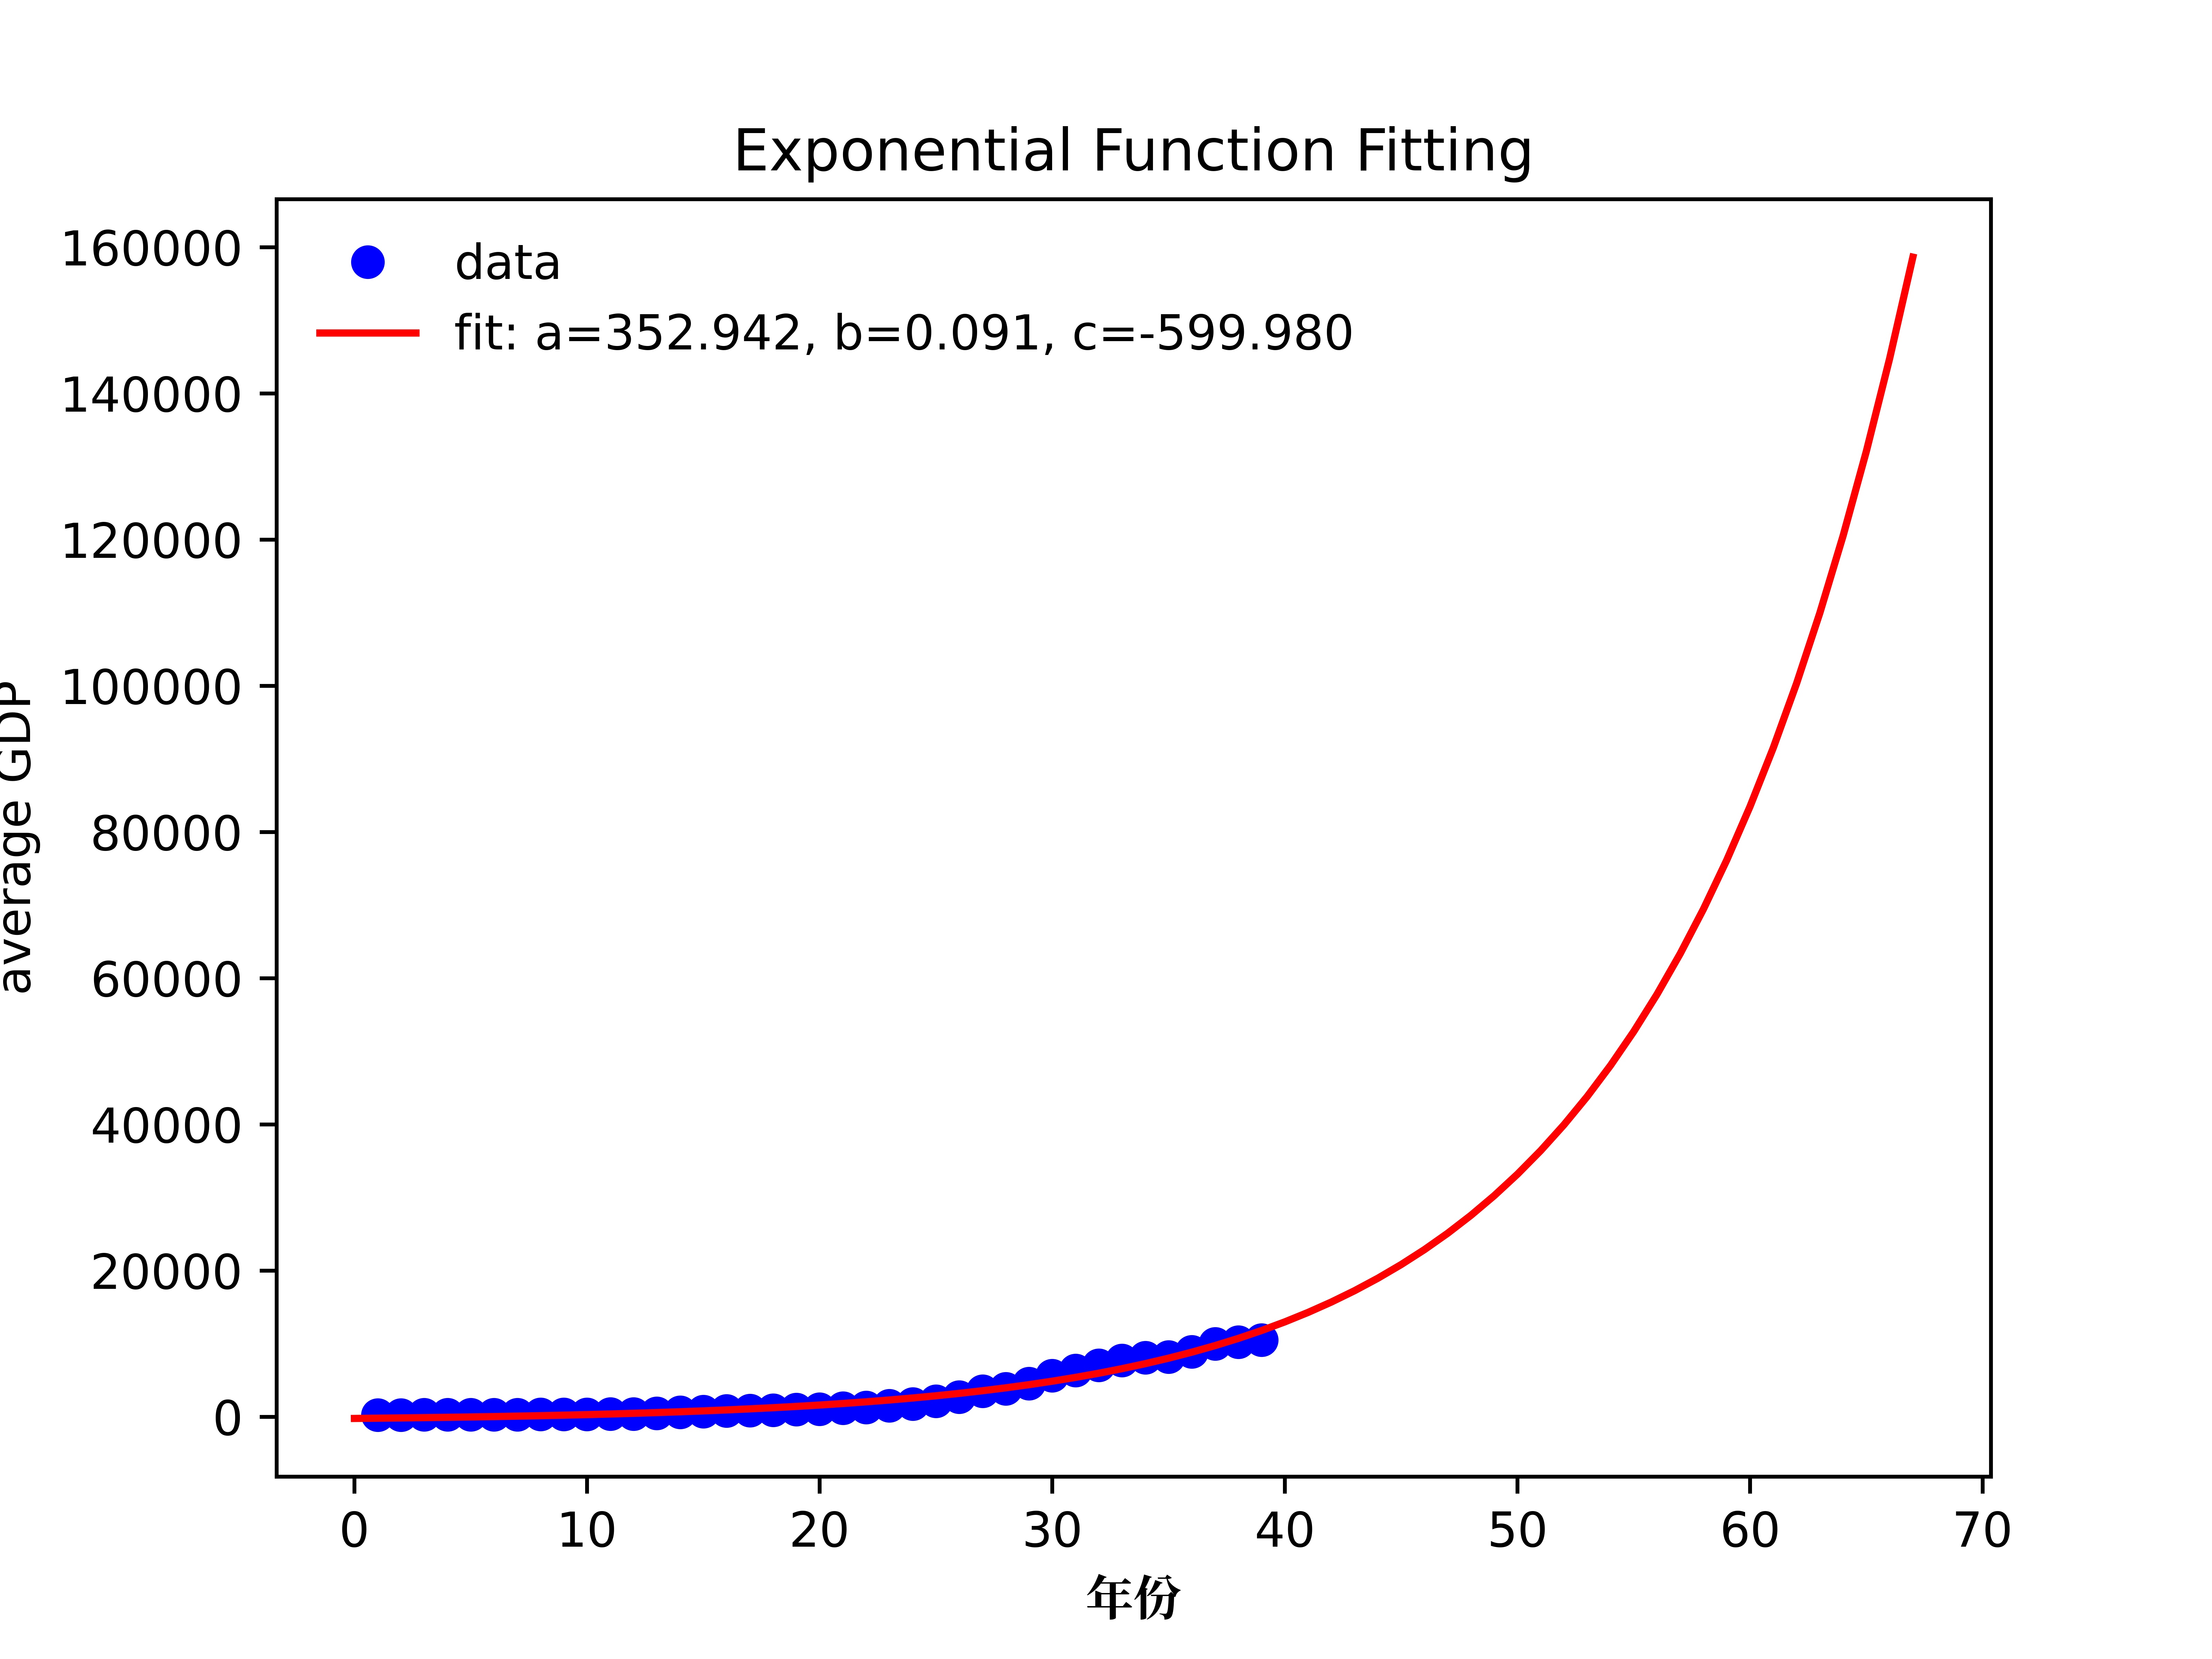
- 结果图例
- 数据[2]
- Tips
实现
代码
#Header
import numpy as np
import matplotlib as mpl
import matplotlib.pyplot as plt
from scipy.optimize import curve_fit

#Define a function(here a exponential function is used)
def func(x, a, b, c):
 return a * np.exp(b * x) + c

fo = open("data.txt", 'r')
xdata = list()
ydata = list()
entry = fo.readline()
#start_year = 1982
offset = 0
while entry:
    offset += 1
    lt = entry.split('t')
    data = lt[1]
    data = data.rstrip('n') #data format 1982t203n
    xdata.append(offset)
    ydata.append(int(data))
    entry = fo.readline()
xdata = np.array(xdata)
ydata = np.array(ydata)
plt.plot(xdata, ydata, 'bo', label='data') #mark the scatter

#Fit for the parameters a, b, c of the function func:
popt, pcov = curve_fit(func, xdata, ydata)
popt #output: array([ 2.55423706, 1.35190947, 0.47450618])
xrge = list()
for i in range(2050-1982):
    xrge.append(i) #draw the curve until 2050
xrge = np.array(xrge)
plt.plot(xrge, func(xrge, *popt), 'r-',
 label='fit: a=%5.3f, b=%5.3f, c=%5.3f' % tuple(popt))

#Labels
plt.title("Exponential Function Fitting")
#fc-list :lang=zh-cn Ubuntu命令行查看已安装字体
zhfont = mpl.font_manager.FontProperties(fname='/usr/share/fonts/opentype/noto/NotoSerifCJK-Bold.ttc')
plt.xlabel('年份', fontproperties=zhfont)
plt.ylabel('average GDP')
plt.legend()
leg = plt.legend()  # remove the frame of Legend, personal choice
leg.get_frame().set_linewidth(0.0) # remove the frame of Legend, personal choice

#Export figure
plt.savefig('fit1.jpg', format='jpg', dpi=1000, facecolor='w', edgecolor='k')
结果图例

数据2
1982	203
1983	225
1984	250
1985	294
1986	281
1987	251
1988	283
1989	310
1990	317
1991	333
1992	366
1993	377
1994	473
1995	609
1996	709
1997	781
1998	828
1999	873
2000	959
2001	1053
2002	1148
2003	1288
2004	1508
2005	1753
2006	2099
2007	2693
2008	3468
2009	3832
2010	4550
2011	5618
2012	6316
2013	7050
2014	7678
2015	8066
2016	8147
2017	8879
2018	9976
2019	10216
2020	10500
Tips
#在start与stop之间生成均匀的num个数据,作为array返回
numpy.linspace(start, stop, num)

#为np随机数生成器插入种子
numpy.random.seed(1111)

#返回size维array,每维X~N(loc, scale^2)
np.random.normal(loc, scale, size)

#拟合参数有限制范围,使用二元tuple,每元可使用列表,假定共3参数
popt, pcov = curve_fit(func, xdata, ydata, bounds=(0, [a, b, c]))
代码主体参考:图様, “使用python做数据拟合”, zhuanlan.zhihu
最后
以上就是清秀月饼最近收集整理的关于使用numpy拟合预测趋势实现的全部内容,更多相关使用numpy拟合预测趋势实现内容请搜索靠谱客的其他文章。
本图文内容来源于网友提供,作为学习参考使用,或来自网络收集整理,版权属于原作者所有。


发表评论 取消回复