Programming Exercise 1:
Linear Regression Machine Learning
总体目录
- Linear regression with one variable
- 1.题目描述
- 2.详细代码解释
- step 1:首先导入相关的库包 Import Libraries
- step 2:读入数据 Read-In Data
- step 3:可视化散点图 Visualized
- step 4:计算代价函数的表达式J(θ) Cost Function
- step 5:梯度下降算法 Gradient Descent Algorithm
- step 6:正规方程 Normal Equation
- 3.可视化结果
- 可视化数据
- 导用库包
- 完整代码
在这一部分有一个机器学习实战,机器学习实战三: 预测汽车油耗效率 MPG,看完这一部分可以实战一下
如果想了解更多的知识,可以去我的机器学习之路 The Road To Machine Learning 通道
Linear regression with one variable
1.题目描述
In this part of this exercise, you will implement linear regression with one variable to predict profits for a food truck. Suppose you are the CEO of a restaurant franchise and are considering different cities for opening a new outlet. The chain already has trucks in various cities and you have data for profits and populations from the cities.You would like to use this data to help you select which city to expand to next.The file ex1data1.txt contains the dataset for our linear regression problem. The first column is the population of a city and the second column is the profit of a food truck in that city. A negative value for profit indicates a loss.
简单来说,现在假设你是一家连锁餐厅的首席执行官,正在考虑在不同的城市开一家新餐厅。该连锁店已经在多个城市拥有卡车,你可以从这些城市获得利润和人口数据。
现在您希望使用这些数据来帮助您选择下一步扩展到哪个城市,所以需要使用一个变量实现线性回归,以预测食品卡车的利润。
然后对于数据来说,文件ex1data1.txt包含我们的线性回归问题的数据集。第一列是一个城市的人口第二列是该城市一辆快餐车的利润。利润为负数表示亏损。
2.详细代码解释
step 1:首先导入相关的库包 Import Libraries
import numpy as np
import matplotlib.pyplot as plt
import pandas as pd
from matplotlib.colors import LogNorm
from mpl_toolkits.mplot3d import axes3d, Axes3D
step 2:读入数据 Read-In Data
path = '../data/ex1data1.txt' # 文件路径
data = pd.read_csv(path, header=None, names=['Population', 'Profit']) # 读入文件到data
这时候我们可以用data.head()和 data.descibe()观察一下读入的数据是否是正确的,并观察得到的数据
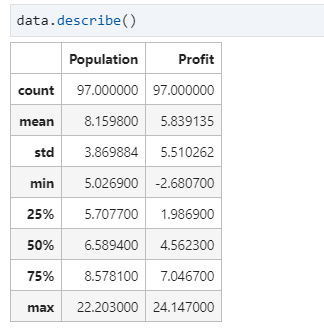
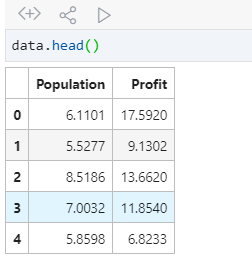
出现如此说明已经读入成功了 Population 代表的是人数 Profit代表的是利益
step 3:可视化散点图 Visualized
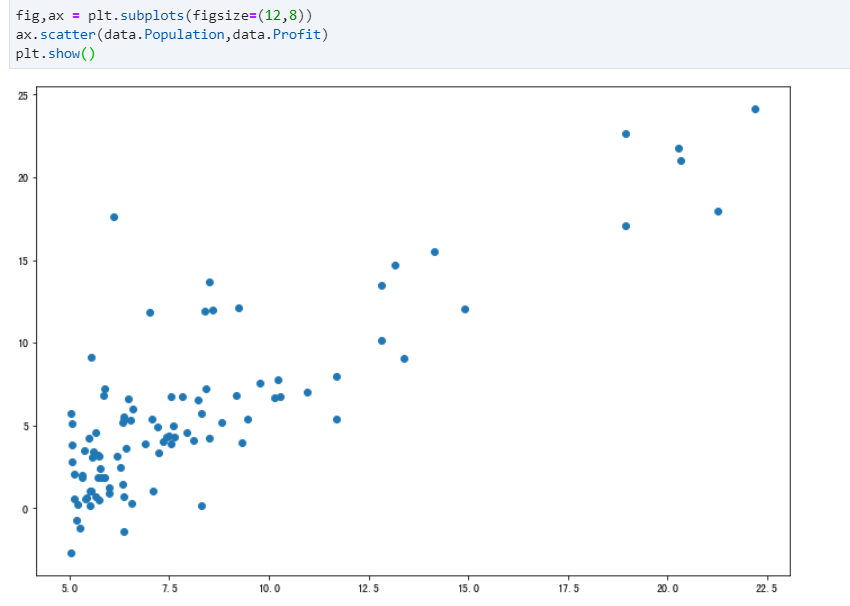
step 4:计算代价函数的表达式J(θ) Cost Function
由于我们需要建立一个线性回归模型,首先的主要思路是我们要计算代价函数,代价函数的公式如下:

为了保证h(x)包含常数项,所以增加一个特征变量x0=1,体现在表中为增加一列为1的数据,一般来说,在线性回归中,第一个特征变量均看为1。
处理完数据后,可以根据公式去定义代价函数,这里用了矩阵的乘法
data.insert(0,'ones',1) # 多加一列为1的数据

# 定义代价函数
def computeCost(X, y, theta):  # 代价函数
    inner = np.power((np.dot(X, theta.T) - y), 2)
    return np.sum(inner) / (2 * len(X))
除此之外,由于我们得到数据的代价,所以我们要对数据进行一些提取,在理论上
X:特征变量的矩阵,维数为 (n+1)×1
y:真实的利润,(h(x)-y)^2表示建模误差
theta:h(x)中对x进行线性组合的参数矩阵,从(0,0)开始尝试
.T表示转置、np.power( , )求平方、np.dot( , )或 * 为矩阵相乘
cols = data.shape[1] # 得到data的列数
X = data.iloc[:, 0:cols - 1]
#去掉data的最后一列 :取所有行,0列到cols-1列
y = data.iloc[:, cols - 1:cols]
#得到data的最后一列,取所有行
X = np.matrix(X.values)
y = np.matrix(y.values)
theta = np.matrix(np.array([0, 0]))# 初始化为(0,0)进行尝试

computeCost(X, y, theta) # 调用代价函数进行计算
最后得出来的代价大约是32.072733877455676,如果数值相近说明对了
step 5:梯度下降算法 Gradient Descent Algorithm
线性回归中,最重要的就是梯度下降算法,具体算法在这里不一一解释,其实主要是不断的更新theta,以此取得到代价值最小的。在这其中,还有一个学习率,学习率可以理解为,每次更新的步长,以此来进行更新。
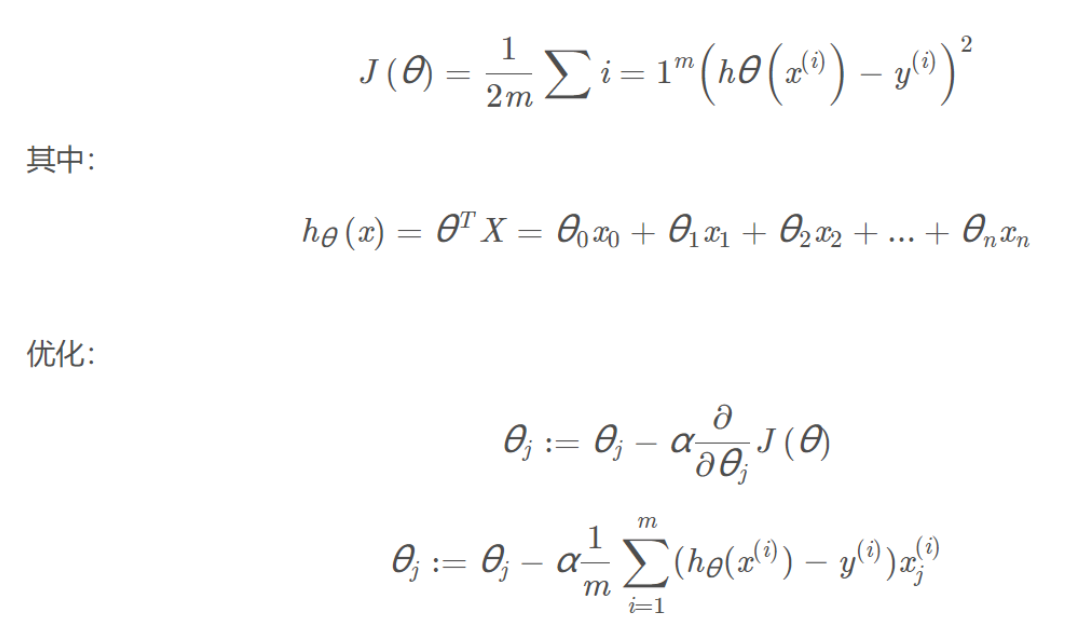
然后就可以定义梯度下降函数了,这里面分别由X,y,theta,学习率和迭代次数,理论上来说,学习率越低,就越准确,但是过低的学习率会导致执行的时间很长,需要很长的迭代时间才能找到最小值点,过高的学习率又会导致永远无法找到那个局部最小值。迭代次数其实就是每次对theta更新的次数,理论上来说,迭代次数越多,theta越稳定,得到的答案越可靠
def gradientDescent(X,y,theta,alpha,iters):
    tmp = np.matrix(np.zeros(theta.shape)) #初始化的1x2临时矩阵
    cost = np.zeros(iters) #初始不同的θ组合对应的J(θ)
    m = X.shape[0] #数据的组数即X矩阵的行数
    for i in range(iters): #迭代iters次
        tmp = theta - ( alpha / m )*( X * theta.T - y ).T * X
        #X(97,2),theta.T(2,1),y(97,1)
        theta = tmp
        cost[i] = computeCost(X,y,theta)
    return theta,cost

alpha = 0.01 # 学习率
iters = 1000 # 迭代次数

final_theta,cost = gradientDescent(X,y,theta,alpha,iters)
print(final_theta,type(final_theta))
computeCost(X, y,final_theta)
可以得到这样的结果

step 6:正规方程 Normal Equation
在线性代数中,有一种计算代价函数J最小值的算法:正规方程
这种方法不需要梯度下降这种迭代算法,但是处理大型数据集的时候,还是更加推荐梯度下降算法。
在本文最后会给出本人正规方程的推导过程,这里先给出公式,可以通过一个公式的计算就可以得出最后的theta矩阵

这里说一下,@其实是矩阵乘法的一种形式,其中也可以写成np.dot,X.T为X的转置。除此之外np.linalg.inv其实是求它的逆。
np.linalg.inv():矩阵求逆
关于矩阵的乘法的各个表示方法详细可以看看这里->戳它
在正规方程中,还有一个非常好的点,他可以计算矩阵的逆或者是伪逆来直接计算,如果没有逆矩阵,就可以直接求伪逆也是可以的。
def normalEqn(X,y):# 正规方程解法
    theta = np.linalg.inv(X.T@X)@X.T@y
    return theta

final_theta = normalEqn(X,y)
print(final_theta,type(final_theta))
print(final_theta[0,0],final_theta[1,0])
可以得到如下结果,可以看得出来,结果与梯度下降法的结果是很相近的,并且更加好,因为我尝试减小学习率和增加迭代次数,最后得到的结果和正规方程的解几乎一样。
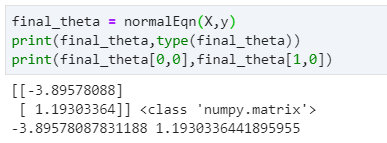
所以,只要特征变量的数目并不大,标准方程是一个很好的计算theta的替代方法,具体地说,只要特征变量的数量小于一万,通常使用正规方程而不是梯度下降。
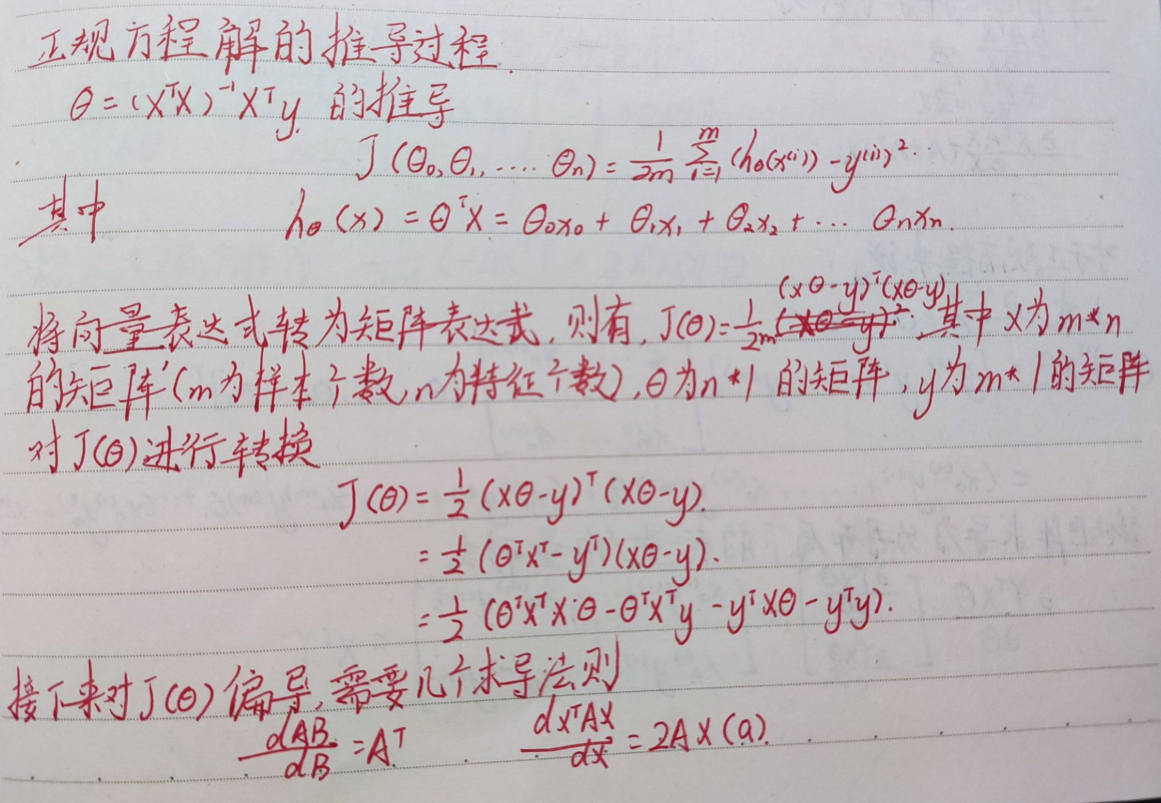
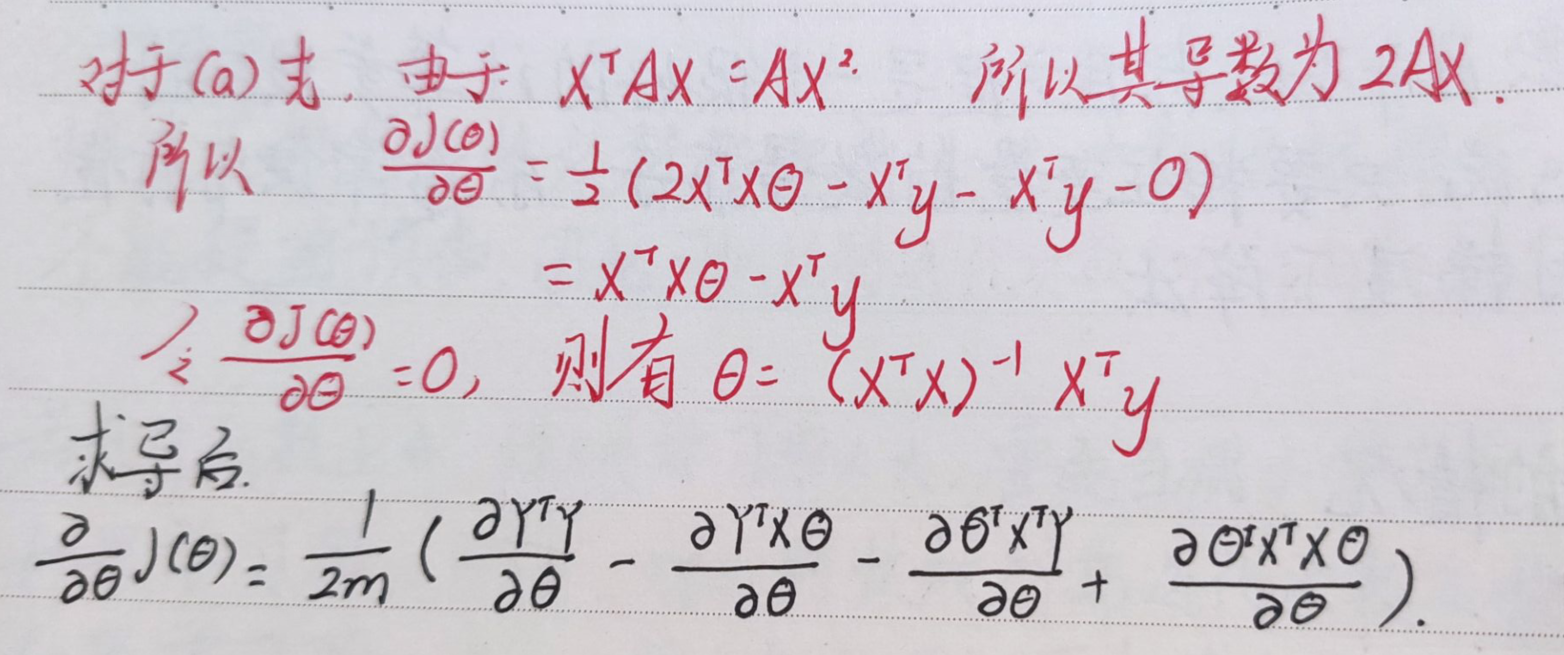
3.可视化结果
可视化数据
最后可以可视化出最后拟合出来线性回归曲线
# f = final_theta[0, 0] + (final_theta[0, 1] * x)
f = final_theta[0,0] + (final_theta[1,0] * x)
fig, ax = plt.subplots(figsize=(12,8)) #调整画布的大小
ax.plot(x, f, 'r', label='Prediction') #画预测的直线 并标记左上角的标签
ax.scatter(data.Population, data.Profit, label='Traning Data') #画真实数据的散点图 并标记左上角的标签
ax.legend(loc=2) #显示标签
ax.set_xlabel('Population') #设置横轴标签
ax.set_ylabel('Profit')
ax.set_title('Predicted Profit vs. Population Size') #设置正上方标题
plt.show() #显示图像
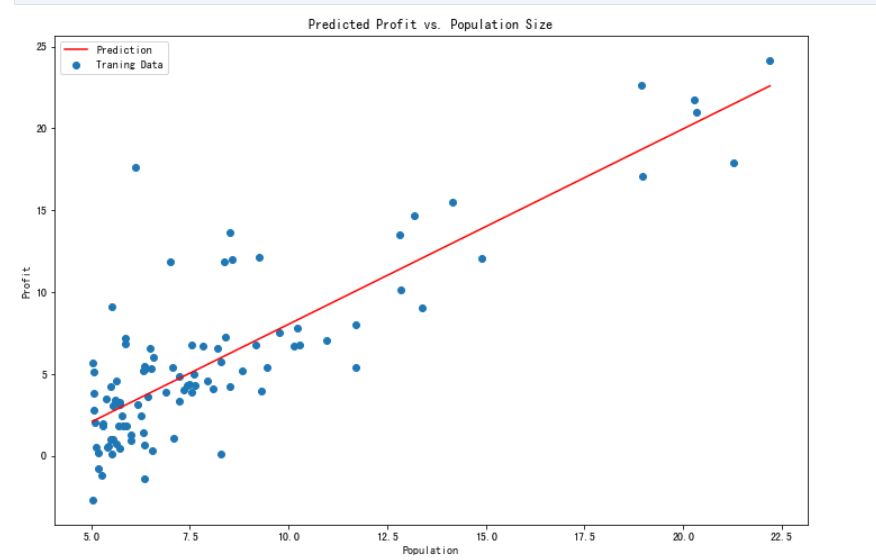
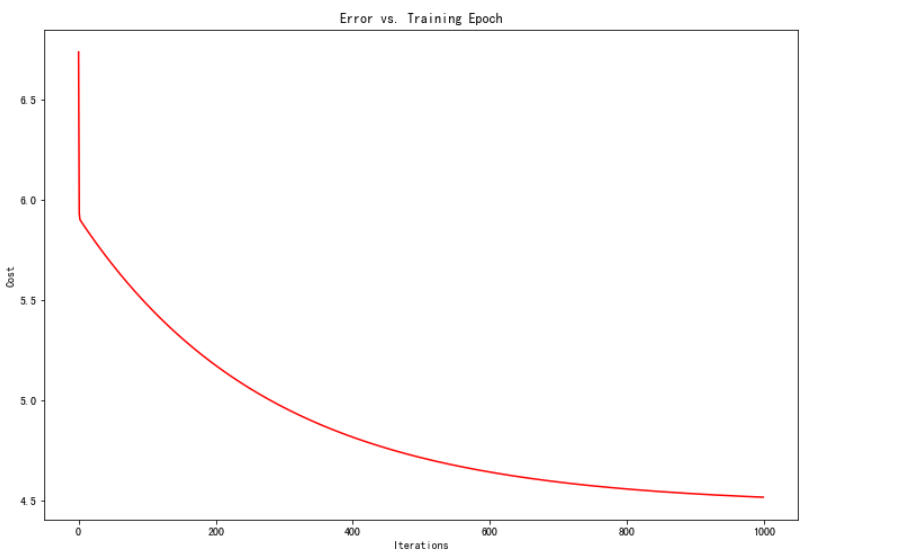
同时,可视化了代价函数随着迭代次数的变化的趋势的曲线图
fig, ax = plt.subplots(figsize=(12,8))
ax.plot(np.arange(iters),cost,color='r')

ax.set_xlabel('Iterations')
ax.set_ylabel('Cost')
ax.set_title("Error vs. Training Epoch")
plt.show()
导用库包
最后,可以说说,python语言强大的一个很重要的方面就是他有很多的库,所以我们其实可以直接调用库函数来帮我们去建立一个线性回归模型,一样可以拟合出代价最小的曲线
# 利用库的知识
from sklearn import linear_model
model = linear_model.LinearRegression()
model.fit(X, y)

x = np.array(X[:, 1].A1)
f = model.predict(X).flatten()

fig, ax = plt.subplots(figsize=(12,8))
ax.plot(x, f, 'r', label='Prediction')
ax.scatter(data.Population, data.Profit, label='Traning Data')
ax.legend(loc=2)
ax.set_xlabel('Population')
ax.set_ylabel('Profit')
ax.set_title('Predicted Profit vs. Population Size')
plt.show()
当然,除了单变量的线性回归,也有多变量的线性回归,但是方法是一样的,只不过如果是三维以上的,就很难去可视化出来,但是我们可以根据所给的特征去拟合出代价最小的数据。
这就是我们踏入机器学习的第一步!!!
A bold attempt is half success. (勇敢的尝试是成功的一半)
完整代码
最后给出完整代码
import numpy as np
import matplotlib.pyplot as plt
import pandas as pd
from matplotlib.colors import LogNorm
from mpl_toolkits.mplot3d import axes3d, Axes3D

def computeCost(X, y, theta):  # 代价函数
    inner = np.power((np.dot(X, theta.T) - y), 2)
    return np.sum(inner) / (2 * len(X))

path = '../data/ex1data1.txt'
data = pd.read_csv(path, header=None, names=['Population', 'Profit'])

fig,ax = plt.subplots(figsize=(12,8))
ax.scatter(data.Population,data.Profit)
plt.show()

data.insert(0, 'ones', 1)

cols = data.shape[1]
X = data.iloc[:, 0:cols - 1]
y = data.iloc[:, cols - 1:cols]
X = np.matrix(X.values)
y = np.matrix(y.values)
theta = np.matrix(np.array([0, 0]))

def gradientDescent(X,y,theta,alpha,iters):
    tmp = np.matrix(np.zeros(theta.shape)) #初始化的1x2临时矩阵
    cost = np.zeros(iters) #初始不同的θ组合对应的J(θ)
    m = X.shape[0] #数据的组数即X矩阵的行数
    for i in range(iters): #迭代iters次
        tmp = theta - ( alpha / m )*( X * theta.T - y ).T * X
        #X(97,2),theta.T(2,1),y(97,1)
        theta = tmp
        cost[i] = computeCost(X,y,theta)
    return theta,cost

alpha = 0.01
iters = 1000

final_theta,cost = gradientDescent(X,y,theta,alpha,iters)
print(final_theta,type(final_theta))
computeCost(X, y,final_theta)

def normalEqn(X,y):
    theta = np.linalg.inv(X.T@X)@X.T@y
    return theta

x = np.linspace(data.Population.min(),data.Population.max(),100)

# f = final_theta[0, 0] + (final_theta[0, 1] * x)
f = final_theta[0,0] + (final_theta[1,0] * x)
fig, ax = plt.subplots(figsize=(12,8)) #调整画布的大小
ax.plot(x, f, 'r', label='Prediction') #画预测的直线 并标记左上角的标签
ax.scatter(data.Population, data.Profit, label='Traning Data') #画真实数据的散点图 并标记左上角的标签
ax.legend(loc=2) #显示标签
ax.set_xlabel('Population') #设置横轴标签
ax.set_ylabel('Profit')
ax.set_title('Predicted Profit vs. Population Size') #设置正上方标题
plt.show() #显示图像
fig, ax = plt.subplots(figsize=(12,8))
ax.plot(np.arange(iters),cost,color='r')

ax.set_xlabel('Iterations')
ax.set_ylabel('Cost')
ax.set_title("Error vs. Training Epoch")
plt.show()
每日一句
You are a landscape, no need in the scenery inside looking up to others.
(你就是一道景色 ,没必要在他人景色里面仰视)
如果需要数据和代码,可以自提
- 路径1:我的gitee
- 路径2:百度网盘
链接:https://pan.baidu.com/s/1uA5YU06FEW7pW8g9KaHaaw
提取码:5605
最后
以上就是霸气棒棒糖最近收集整理的关于吴恩达机器学习ex1 Linear Regression (python)Linear regression with one variable的全部内容,更多相关吴恩达机器学习ex1内容请搜索靠谱客的其他文章。


发表评论 取消回复