from bs4 import BeautifulSoup
from pyecharts import options as opts
from pyecharts.charts import Line, Liquid, Pie, Page,Radar, Geo, Scatter3D, WordCloud, EffectScatter, Tree
import random
from pyecharts.globals import SymbolType
def tab1(name, color): # 标题
c = (Pie().
set_global_opts(
title_opts=opts.TitleOpts(title=name, pos_left='center', pos_top='center',
title_textstyle_opts=opts.TextStyleOpts(color=color, font_size=25))))
return c
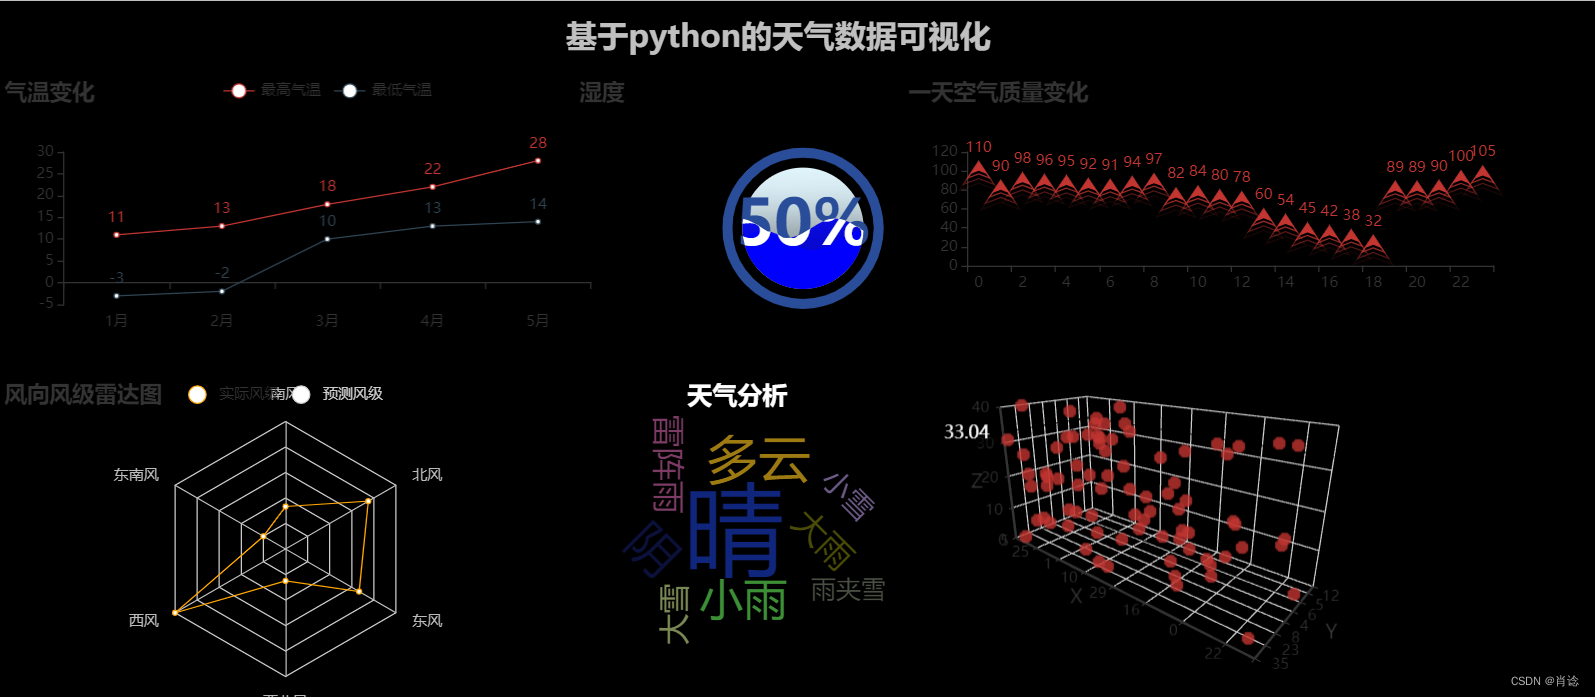
def line(): # 折线图
data = ["1月", "2月", "3月", "4月", "5月"]
high_temperature = [11, 13, 18, 22, 28]
low_temperature = [-3, -2, 10, 13, 14]
c = (
Line()
.add_xaxis(data)
.add_yaxis("最高气温", high_temperature)
.add_yaxis("最低气温", low_temperature)
.set_global_opts(title_opts=opts.TitleOpts(title="气温变化"))
#.render("line_base.html")
)
return c
#水球图
def liquid():
c = (
Liquid()
.add('lq', [0.5, 0.4], color=['blue'],
is_animation=True,
is_outline_show=True)
.set_global_opts(title_opts=opts.TitleOpts(title="湿度"))
)
return c
#词云图
def wordcloud():
data = [('晴', '96'), ('多云', '36'), ('小雨', '26'),
('阴', '32'), ('雷阵雨', '12'), ('小雪', '7'),
('雨夹雪', '2'), ('大雪', '9'), ('大雨', '13')]
c = (WordCloud()
.add(series_name="天气分析",
data_pair=data,
word_size_range=[20, 80],
width='550', # 宽度
height='450', # 高度
word_gap=8,
) # 增加数据
.set_global_opts(
title_opts=opts.TitleOpts(pos_left='center',
title="天气分析",
title_textstyle_opts=opts.TextStyleOpts(font_size=20,
color="white") # 设置标题
),
tooltip_opts=opts.TooltipOpts(is_show=True,
background_color='red',
border_color='green')
)
)# 不显示工具箱
return c
#涟漪散点图
def Effectscatter():
cate = ['0', '1', '2', '3', '4', '5', '6', '7', '8', '9', '10', '11',
'12', '13', '14', '15', '16', '17', '18', '19', '20', '21', '22', '23']
bate = ['110', '90', '98', '96', '95', '92', '91', '94', '97', '82', '84', '80',
'78', '60', '54', '45', '42', '38', '32', '89', '89', '90', '100', '105']
c = (
EffectScatter()
.add_xaxis(cate)
.add_yaxis("", bate, symbol=SymbolType.ARROW)
.set_global_opts(title_opts=opts.TitleOpts(title="一天空气质量变化"))
#.render("effectscatter_symbol.html")
)
return c
# 画风向风级雷达图
def rader():
v1 = [[2, 1, 3, 1, 2, 3]]
v2 = [[5, 2, 1, 3, 2, 4]]
c = (
Radar()
.add_schema(
schema=[
opts.RadarIndicatorItem(name="南风", max_=6),
opts.RadarIndicatorItem(name="东南风", max_=5),
opts.RadarIndicatorItem(name="西风", max_=3),
opts.RadarIndicatorItem(name="西北风", max_=4),
opts.RadarIndicatorItem(name="东风", max_=3),
opts.RadarIndicatorItem(name="北风", max_=4),
]
)
.add("实际风级", v1, color='#FFA500')
.add("预测风级", v2, color='#FFFF00')
.set_series_opts(label_opts=opts.LabelOpts(is_show=False, color='red'))
.set_global_opts(
legend_opts=opts.LegendOpts(selected_mode="single"),
title_opts=opts.TitleOpts(title="风向风级雷达图", ),
)
#.render("radar_selected_mode.html")
)
return c
def scatter3D():
data = [(random.randint(0, 40), random.randint(0, 40), random.randint(0,40)) for _ in range(80)]
c = (Scatter3D()
.add("", data)
.set_global_opts(
title_opts=opts.TitleOpts(""),
)
)
return c
# 绘制:整个页面
page = Page()
page.add(
line(),
tab1("基于python的天气数据可视化", "#C0C0C0"),
liquid(),
wordcloud(),
Effectscatter(),
rader(),
scatter3D()
)
page.render("center.html")
with open("center.html", "r+", encoding='utf-8') as html:
html_bf = BeautifulSoup(html, 'lxml')
divs = html_bf.select('.chart-container')
divs[0]["style"] = "width:40%;height:40%;position:absolute;top:10%;left:0%;"
divs[1]["style"] = "width:35%;height:10%;position:absolute;top:0%;left:30%;"
divs[2]["style"] = "width:28%;height:40%;position:absolute;top:10%;left:35%;"
divs[3]["style"] = "width:30%;height:40%;position:absolute;top:50%;left:30%;"
divs[4]["style"] = "width:40%;height:35%;position:absolute;top:10%;left:55%;"
divs[5]["style"] = "width:35%;height:45%;position:absolute;top:50%;left:0%;"
divs[6]["style"] = "width:60%;height:50%;position:absolute;top:40%;left:40%;"
body = html_bf.find("body")
body["style"] = "background-color:#000000" # 背景颜色
html_new = str(html_bf)
html.seek(0, 0)
html.truncate()
html.write(html_new)
最后
以上就是端庄大侠最近收集整理的关于Python:制作天气数据可视化大屏的全部内容,更多相关Python内容请搜索靠谱客的其他文章。
本图文内容来源于网友提供,作为学习参考使用,或来自网络收集整理,版权属于原作者所有。


发表评论 取消回复