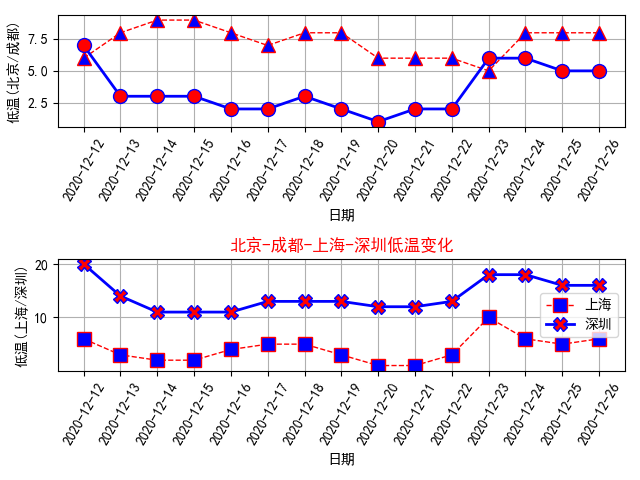
在一张图中画4条折线。举例,读取北京、成都、上海、深圳四城市的天气预报气温数据,然后在一张图中用四根折线绘制气温变化。
Python代码如下:
import pandas as pd
import matplotlib.pyplot as plt
import requests
import re
import json

CITY = {'北京': 101010100, '成都': 101270101, '上海': 101020100, '深圳': 101280601}
MARKER = ['^', 'o', 's', 'X']

DEBUG = False


# 根据字典的值value获得该值对应的key
def get_dict_key(dic, value):
    keys = list(dic.keys())
    values = list(dic.values())
    idx = values.index(value)
    key = keys[idx]
    return key


def get_data(city_code):
    if DEBUG:
        f = open('w.json', mode='r', encoding='utf-8')
        ss = f.read()
        js = json.loads(ss)
    else:
        url = f'http://t.weather.itboy.net/api/weather/city/{city_code}'
        r = requests.get(url=url)
        js = r.json()

    forecast = js['data']['forecast']
    df = pd.DataFrame(data=forecast)

    date = df['ymd']
    temp_high = df['high']
    temp_high = [int(re.findall(r'd+', v)[0]) for v in temp_high]
    temp_low = df['low']
    temp_low = [int(re.findall(r'd+', v)[0]) for v in temp_low]

    return (date, temp_low, temp_high, city_code)


def draw_line(axs, data, i):
    axs[i].plot(data[2 * i][0],
                data[2 * i][1],
                color='red',
                linewidth=1,
                linestyle='--',
                marker=MARKER[2 * i],
                markerfacecolor='blue',
                markersize=10,
                label=get_dict_key(CITY, data[2 * i][3]))

    axs[i].plot(data[2 * i + 1][0],
                data[2 * i + 1][1],
                color='blue',
                linewidth=2,
                linestyle='-',
                marker=MARKER[2 * i + 1],
                markerfacecolor='red',
                markersize=10,
                label=get_dict_key(CITY, data[2 * i + 1][3]))

    axs[i].set_xlabel('日期')
    axs[i].set_ylabel(
        '低温(' + get_dict_key(CITY, data[2 * i][3]) + '/' + get_dict_key(CITY, data[2 * i + 1][3]) + ')')
    axs[i].grid(True)


def main():
    data = []
    for code in list(CITY.values()):
        data.append(get_data(code))

    plt.rcParams['font.sans-serif'] = ['SimHei']  # 中文乱码
    plt.rcParams['axes.unicode_minus'] = False  # 正负号

    fig, axs = plt.subplots(nrows=2, ncols=1, constrained_layout=False)

    for i in range(len(axs)):
        draw_line(axs, data, i)

    for i in range(len(axs)):
        for tick in axs[i].get_xticklabels():
            tick.set_rotation(60)

    plt.title("北京-成都-上海-深圳低温变化", fontdict=dict(color='r'))
    fig.tight_layout()

    plt.legend()
    plt.show()


if __name__ == '__main__':
    main()
输出结果:

最后
以上就是细腻西牛最近收集整理的关于Python:matplotlib一表多图一图多表的全部内容,更多相关Python内容请搜索靠谱客的其他文章。
本图文内容来源于网友提供,作为学习参考使用,或来自网络收集整理,版权属于原作者所有。
![[Python]使用matplotlib库实现在Cell中不完全填充颜色](https://www.shuijiaxian.com/files_image/reation/bcimg3.png)


发表评论 取消回复