Section #2. Kernel Probes
Kernel probes can intrude into a kernel function and extract debug information or apply a medicated patch. It’s a useful addition to your debugging repertoire for investigating inexplicable behavior at a customer site, especially when you don’t have the luxury of rebooting the system. Linux supports a generic form of kernel probes called Kprobes and two specialized variants, Jprobes and return probes.
内核探针可以侵入内核函数并提取调试信息或应用补丁。它对调试客户站点无法解释的行为特别有用,特别是当您不能重新启动系统时。 Linux支持称为Kprobes的内核探测器和两个专用变体,Jprobes和返回探测器。
Kprobes
Kprobes can save you the trouble of building and booting a debug kernel by providing capabilities to dynamically dump kernel data structures or insert code into a running kernel. You can, for example, add a few printks on-the-fly inside the scheduler without recompiling the kernel. You can even patch a bug on a Mars rover without rebooting it.
Kprobes通过提供动态转储内核数据结构或将代码插入正在运行的内核的功能,为您省去构建和引导调试内核的麻烦。例如,您可以在调度程序中随时添加一些printks,而无需重新编译内核。您甚至可以修补火星探测器上的错误而无需重新启动它。
To insert a kprobe inside a kernel function, follow these steps要在内核函数中插入kprobe,请按照下列步骤操作:
- Turn on CONFIG_KPROBES (Instrumentation Support → Kprobes) in the kernel configuration menu.
- 在内核配置菜单中打开CONFIG_KPROBES(Instrumentation Support→Kprobes)。
- Implement a kernel module that registers a kprobe at the instruction of interest. You need to register a pre-handler that Kprobes will run just before executing the probed instruction and a post-handler that Kprobes will run after executing the probed instruction. You can also supply a fault-handler that will run if a fault is detected while executing the pre- or post-handlers (because you don’t want to “oops” due to a debugging bug!).
- 实现在感兴趣的指令处注册kprobe的内核模块。您需要注册pre-handler, Kprobes将在被探测指令之前运行的它,以及Kprobes将在被探测指令后运行的post-handler。您还可以提供一个fault-handler,如果在执行前pre-或post-时检测到故障,该fault-handler将运行(因为您不希望由于调试错误而“跳过”!)。
When a kprobe is registered, it saves the probed instruction and replaces it with an instruction that generates a breakpoint (int 0x03 on x86-based systems). When the breakpoint is hit, the kernel generates a die notification. Kprobes inserts itself into the die notifier chain, so it gets notified about the breakpoint hit.
注册kprobe时,它会保存探测到的指令并将其替换为生成断点的指令(x86的系统上是int 0x03)。当命中断点时,内核会生成一个die通知。Kprobes将自身插入到die通知器链中,因此它会收到有关断点命中的通知。
When notified, Kprobes executes the registered pre-handler. Next, it steps through a copy of the probed instruction. It executes a copy instead of swapping the probed instruction with the breakpoint instruction for reasons of SMP consistency. Finally, it runs the post-handler. The pre- and post-handler windows are the hooks offered to the Kprobes user to inject debug code. The handlers can be registered and unregistered on-the-fly, so serviceability is not merely static at compile time but programmable during runtime.
收到通知后,Kprobes将执行已注册的pre-handler。 接下来,它逐步执行探测指令的副本。 由于SMP一致性的原因,它执行副本而不是用断点指令交换的被探测的指令。最后,它运行post-handler。pre-和post-handler的窗口是为Kprobes用户提供的用于注入调试代码的钩子。处理程序可以即时注册和取消注册,因此可维护性不再是静态的,只能在编译时进行,在运行时也可以进行调试。
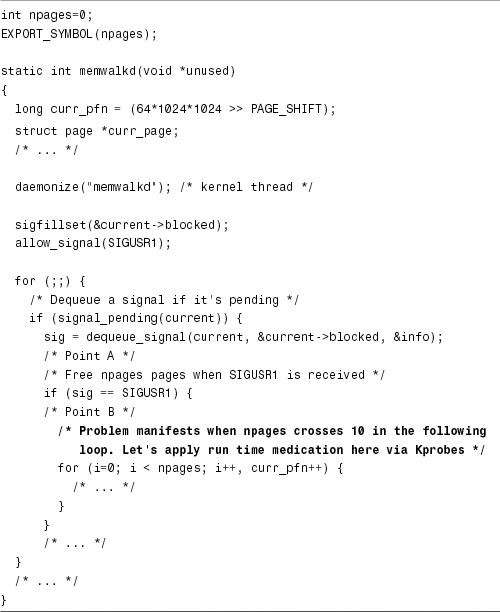
Let’s learn to use Kprobes with the help of an example. Consider the code snippet in Listing 1.2, which is a kernel thread that adds npages number of pages to the free memory pool, whenever a SIGUSR1 signal is delivered to it. Most of the logic has been scissored out of the listing because it’s not relevant. Assume that you are at a customer site to debug a problem reported with this code. You notice bad things whenever npages crosses 10, so you want to apply a runtime patch that limits it to 10.
让我们在一个例子的帮助下学习使用Kprobes。考虑清单1.2中的代码片段,它是一个内核线程,只要向其传递SIGUSR1信号,就会将npages页面数添加到空闲内存池中。大多数无关的逻辑已经从列表中删除。假设您在客户站点调试使用此代码报告的问题。当npages超过10时,你会发现出错了,因此你想要应用一个将其限制为10的运行时补丁。
Listing 1.2. Problem Code (mydrv.c)
Listing 1.3. Registering Kprobe Handlers
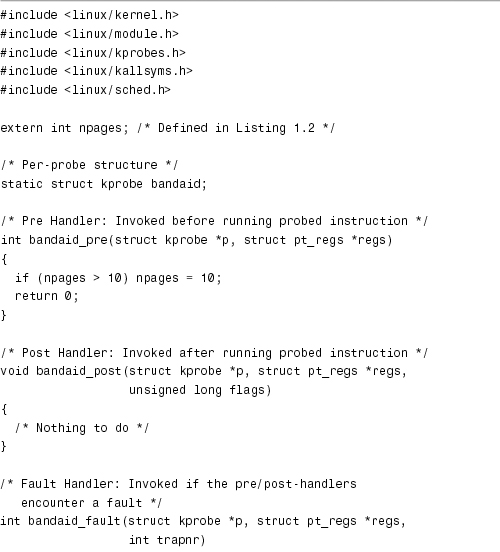
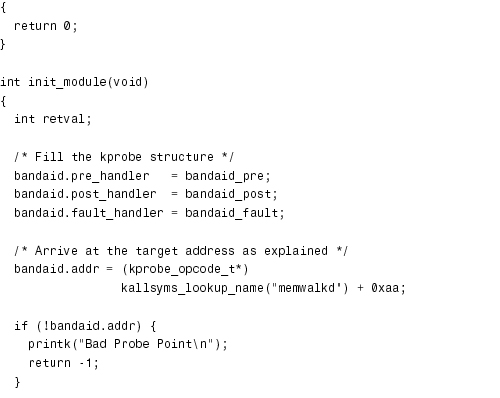
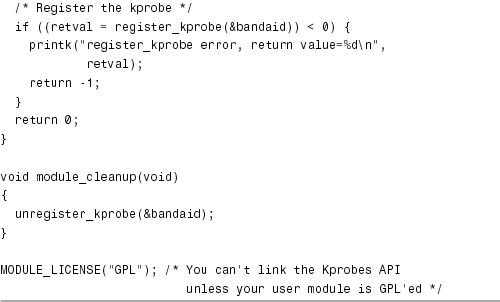
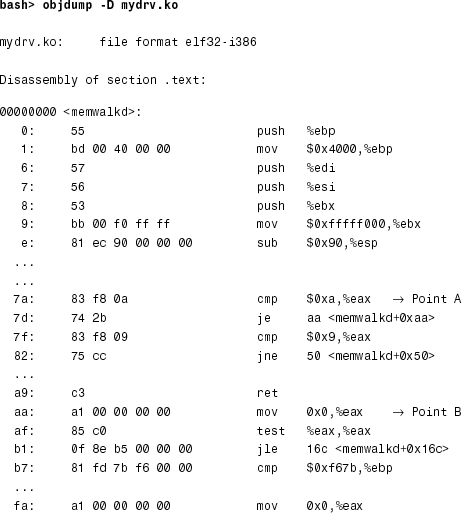
Listing 1.3 uses Kprobes to insert a patch at kallsyms_lookup_name("memwalkd") + 0xaa, which limits npages to 10. To figure out how to arrive at this probe address, take another look at Listing 1.2. You want the patch to be inserted at Point B. To calculate the kernel address at Point B, disassemble the contents of mydrv.ko using objdump:
清单1.3使用Kprobes在kallsyms_lookup_name(“memwalkd”)+ 0xaa处插入补丁,将npages限制为10.要弄清楚如何到达此探测地址,请再看一下代码清单1.2。您希望在B点插入补丁。要计算B点的内核地址,请使用objdump反汇编mydrv.ko的内容:
Note
You have to use an architecture-specific objdump if you’re cross-compiling for a different processor platform. You need something like arm-linux-objdump if you disassemble a binary cross-compiled for an ARM-based target device. Pass the -S option to objdump to mix source code with the disassembled output:
如果您正在为不同的处理器平台进行交叉编译,则必须使用特定于体系结构的objdump。 如果你为基于ARM的目标设备反汇编二进制交叉编译,你需要像arm-linux-objdump这样的东西。将-S选项传递给objdump以将源代码与反汇编输出混合:
bash> arm-linux-objdump –d –S mydrv.ko
If you try and match the C code in Listing 1.2 with its preceding disassembled dump, you can associate Point A and Point B with the shown kernel addresses. kallsyms_lookup_name()[6] locates the address of memwalkd(), and 0xaa is the offset where Point B resides, so apply the kprobe at kallsyms_lookup_name("memwalkd") + 0xaa.
如果尝试将清单1.2中的C代码与其前面的反汇编转储匹配,则可以将Point A和Point B与显示的内核地址相关联。kallsyms_lookup_name()[6]定位memwalkd()的地址,0xaa是Point B所在的偏移量,因此将kprobe应用于kallsyms_lookup_name(“memwalkd”)+ 0xaa。
[6] You have to enable CONFIG_KALLSYMS during kernel configuration to obtain the services of this function.
After you register the kprobe, memwalkd() equivalently looks like this:
注册kprobe之后,memwalkd()的实际效果是这样:
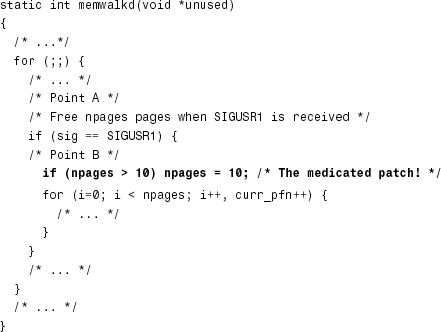
Whenever npages is assigned a value greater than 10, the kprobed patch pulls it back to 10, thus stepping around the problem.
每当为npages分配一个大于10的值时,kprobed补丁将其拉回到10,从而解决问题。
In the next two sections, let’s look at a couple of helper facilities that make it easier to use Kprobes during function entry and exit.
在接下来的两节中,让我们看看几个辅助工具,它们可以在函数进入和退出期间更轻松地使用Kprobes。
Jprobes
A jprobe is a specialized kprobe. It eases the work of adding a probe when the point of investigation is at the entry to a kernel function. The jprobe handler has the same prototype as the probed function. It’s invoked with the same argument list as the probed function, so you can easily access the function arguments from the jprobe handler. If you use Kprobes rather than Jprobes, imagine the hassles your probe handler needs to undergo, wading through the dark alleys of the function stack to extract function arguments! And this code that delves into the stack to elicit argument values has to be heavily function-specific, not to mention being architecture-dependent and unportable.
jprobe是一种专门的kprobe。当调查点位于内核函数的入口处时,它简化了添加探测的工作。jprobe处理程序与被探测函数具有相同的原型。它使用与被探测函数相同的参数列表,因此您可以轻松地从jprobe处理程序访问函数参数。 如果你使用Kprobes而不是Jprobes,想象你的探针处理程序需要经历的麻烦,趟过函数堆栈的黑暗小巷来提取函数参数!并且这个深入到堆栈以引出参数值的代码必须是特定于函数的,更不用说依赖于体系结构和不可移植。
To learn how to use Jprobes, let’s revert to an example. Assume that you’re debugging a network device driver (that is built as part of the kernel) by looking at the printk() messages it’s generating. The driver is emitting crucial values in octal (base 8), but to your horror, the driver writer has introduced a typo in the print format string by coding %O rather than %o. So, all you can see are messages such as this:
要了解如何使用Jprobes,让我们回到一个例子。假设您正在调试网络设备驱动程序(构建为内核的一部分),方法是查看它生成的printk()消息。驱动程序在八进制(基数8)中发出关键值,但令人恐惧的是,驱动程序编写者通过编码%O而不是%o在打印格式字符串中引入了拼写错误。所以,你只能看到这样的消息:
Number of Free Receive buffers = %O.
Jprobes to the rescue. You can fix this in a few seconds, without recompiling or rebooting the kernel. First, take a look at printk() defined in kernel/printk.c:
Jprobes来救援。您可以在几秒钟内解决此问题,而无需重新编译或重新启动内核。 首先,看一下kernel/printk.c中定义的printk():
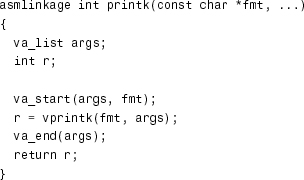
Let’s add a simple jprobe at the entry to printk() and transform every %O into %o. Listing 1.4 does this job. Note that the jprobe handler needs to have the same prototype as printk(). Both functions are marked with the asmlinkage tag that asks them to expect arguments from the stack, rather than from CPU registers.
让我们在printk()的入口处添加一个简单的jprobe,并将每个%O转换为%o。清单1.4完成了这项工作。请注意,jprobe处理程序需要与printk()具有相同的原型。这两个函数都标有asmlinkage标记,要求它们从堆栈中获取参数,而不是来自CPU寄存器。
Listing 1.4. Registering Jprobe Handlers
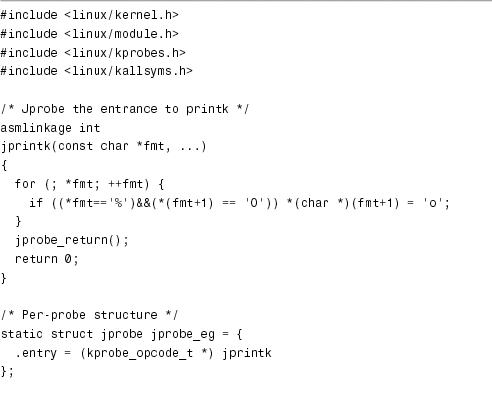
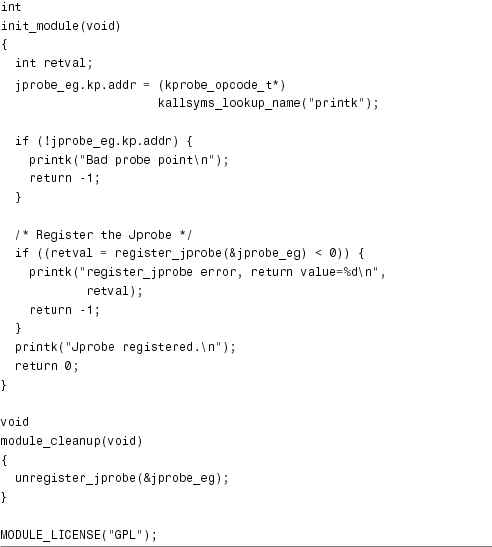
When Listing 1.4 invokes register_jprobes() to register the jprobe, a kprobe is inserted at the beginning of printk(). When this probe is hit, Kprobes replaces the saved return address with that of the registered jprobe handler jprintk(). It then copies a portion of the stack and returns, thus passing control to jprintk() with printk()’s argument list. When jprintk() calls jprobe_return(), the original call state is restored, and printk() continues to execute normally.
When you insert this jprobe user module, the network driver no longer emits useless messages announcing %O buffers, rather it prints saner information such as this:
当代码清单1.4调用register_jprobes()来注册jprobe时,会在printk()的开头插入一个kprobe。当命中此探测时,Kprobes将保存的返回地址替换为已注册的jprobe处理程序jprintk()的返回地址。然后它复制堆栈的一部分并返回,从而通过printk()的参数列表将控制传递给jprintk()。当jprintk()调用jprobe_return()时,将恢复原始调用状态,并且printk()继续正常执行。
当您插入此jprobe用户模块时,网络驱动程序不再发出无用消息,而是打印更加明晰的信息,例如:
Number of Free Receive buffers = 12.
Return Probes
A return probe (or a kretprobe in Kprobes terminology) is another specialized Kprobes helper. It eases the work of inserting a kprobe when you need to probe a function’s return point. If you use vanilla Kprobes to investigate return points, you might need to register them at multiple places because a function can return via multiple code paths. However, if you use return probes, you need to insert only one kretprobe, rather than register, say, 20 Kprobes to cover a function’s 20 return paths.
返回探测器(或Kprobes术语中的kretprobe)是另一个专门的Kprobes辅助函数。当您需要被探测函数的返回点时,它可以简化插入kprobe的工作。如果使用vanilla Kprobes来研究返回点,则可能需要在多个位置注册它们,因为函数可能通过多个代码路径返回。但是,如果使用返回探测器,则只需插入一个kretprobe,而不是注册20个Kprobes来覆盖函数的20个返回路径。
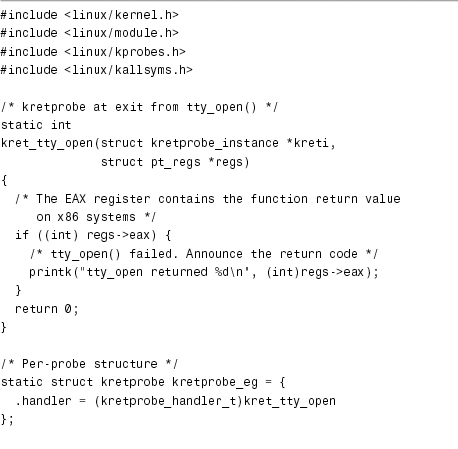
The function tty_open() defined in drivers/char/tty_io.c has seven return paths. The successful path returns 0, and others return error values such as –ENXIO and -ENODEV. A single kretprobe is sufficient to alert you about failures, irrespective of the associated code path. Listing 1.5 implements this kretprobe.
drivers/char/tty_io.c中定义的函数tty_open()有七个返回路径。成功路径返回0,其他路径返回错误值,如-ENXIO和-ENODEV。无论相关的代码路径如何,单个kretprobe足以提醒您出粗。清单1.5实现了这个kretprobe。
Listing 1.5. Registering Return Probe Handlers
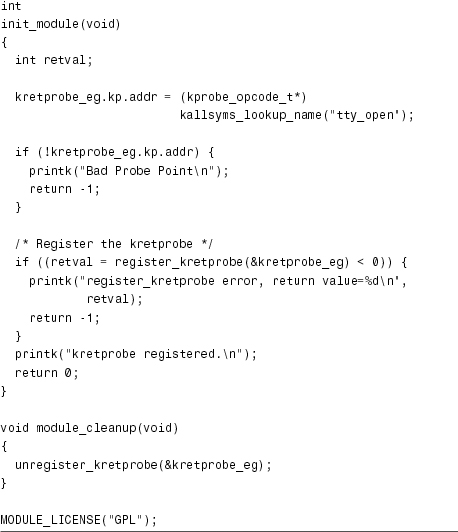
When Listing 1.5 invokes register_kretprobes(), a kprobe is internally inserted at the beginning of tty_open(). When this probe gets hit, this internal kprobe handler replaces the function return address with that of a special routine (called a trampoline in Kprobes terminology). Look at arch/your-arch/kernel/kprobes.c for the implementation of the trampoline.
当清单1.5调用register_kretprobes()时,在tty_open()的内部开头插入一个kprobe。当此探测器被命中时,此内部kprobe处理程序将函数返回地址替换为特殊例程(在Kprobes术语中称为trampoline)。查看arch/your-arch/kernel/kprobes.c以了解trampoline的实现情况。
When tty_open() returns via any of its seven return paths, control returns to the trampoline instead of the caller function. The trampoline invokes the kretprobe handler kret_tty_open(), registered by Listing 1.5, which prints the return value if tty_open() has not returned successfully.
当tty_open()通过其七个返回路径中的任何一个返回时,控制返回到trampoline而不是调用者函数。trampoline调用清单1.5中注册的kretprobe处理程序kret_tty_open(),如果tty_open()未成功返回,则会打印返回值。
Limitations
Kprobes has its limitations. Some of them are obvious. You won’t, for example, see desired results if you insert a kprobe inside an inline function. And, of course, you can’t probe Kprobes code.
Kprobes有其局限性。其中一些是显而易见的。例如,如果在内联函数中插入kprobe,则不会看到所需的结果。当然,您无法探测Kprobes代码。
Kprobes are more useful for applying probes inside the base kernel. If the subject code is part of a dynamically loadable module, you might as well rewrite and recompile your module rather than write and compile a new module to “kprobe” it. However, you might still want to use Kprobes if bringing down the module is not acceptable.
Kprobes对于在基本内核中使用探测更有用。如果代码是动态可加载模块的一部分,那么您也可以重写并重新编译模块,而不是将新模块编写并编译好,然后再“kprobe”它。但是,如果不希望关闭模块,您可能需要使用Kprobes。
There are less-obvious limitations, too. Optimizations are done at compile time, whereas Kprobes are inserted during runtime. So, the effect of inserting instructions via Kprobes is not equivalent to adding code in the original source files. For example, the buggy code snippet
也有不那么明显的限制。优化在编译时完成,而Kprobes在运行时插入。因此,通过Kprobes插入指令的效果并不等同于在原始源文件中添加代码。例如,有缺陷的代码片段
volatile int *integerp = 0xFF;
int integerd = *integerp;
is reduced by the compiler to由编译器优化到
mov 0xff, %eax
So, you can’t easily use Kprobes if you want to sneak in between those two lines of C code, allocate a word of memory, point integerp to the allocated word, and circumvent a kernel crash.
因此,如果你想在这两行C代码之间插入,分配一个内存字,将integerp指向分配的字,并避免内核崩溃,使用Kprobes,不可能做到这一点。
Note
SystemTap (http://sourceware.org/systemtap/) is a diagnostic tool that eases the use of Kprobes.
SystemTap(http://sourceware.org/systemtap/)是一种诊断工具,可以简化Kprobes的使用。
Looking at the Sources
The Kprobes implementation consists of a generic portion defined in kernel/kprobes.c (and include/linux/kprobes.h) and an architecture-dependent part that lives in arch/your-arch/kernel/kprobes.c (and include/asm-your-arch/kprobes.h).
Kprobes实现包含在kernel/kprobes.c(和include/linux/kprobes.h)中定义的通用部分以及存在于arch/your-arch/kernel/kprobes.c(和include/asm-your-arch/ kprobes.h)中与体系结构相关部分。
Peek inside Documentation/kprobes.txt for further information about Kprobes, Jprobes, and Kretprobes.
有关Kprobes,Jprobes和Kretprobes的更多信息,请参阅Documentation/kprobes.txt。
最后
以上就是动人小甜瓜最近收集整理的关于内核探测器的全部内容,更多相关内核探测器内容请搜索靠谱客的其他文章。


发表评论 取消回复