matplotlib库是python最著名的绘图库,它提供了一整套和matlab相似的命令API,适合交互式地进行制图。并且在下面链接中有上百幅缩略图,打开之后都有源程序。因此如果你需要绘制某种类型的图,只需要在这个页面中浏览/复制/粘贴一下,基本上都能搞定。http://matplotlib.org/gallery.html
首先主要看mplot3d toolkit库
demo1
导入库函数
from mpl_toolkits.mplot3d import Axes3D
import matplotlib.pyplot as plt
import numpy as npfig = plt.figure()
ax = fig.add_subplot(111, projection='3d')for c, z in zip(['r', 'g', 'b', 'y'], [30, 20, 10, 0]):
xs = np.arange(20)
ys = np.random.rand(20)
# You can provide either a single color or an array. To demonstrate this,
# the first bar of each set will be colored cyan.
cs = [c] * len(xs)
cs[0] = 'c'
ax.bar(xs, ys, zs=z, zdir='y', color=cs, alpha=0.8)ax.set_xlabel('X')
ax.set_ylabel('Y')
ax.set_zlabel('Z')
plt.show()运行结果如下:
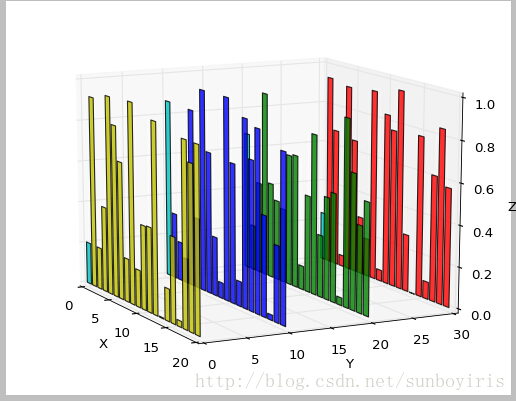
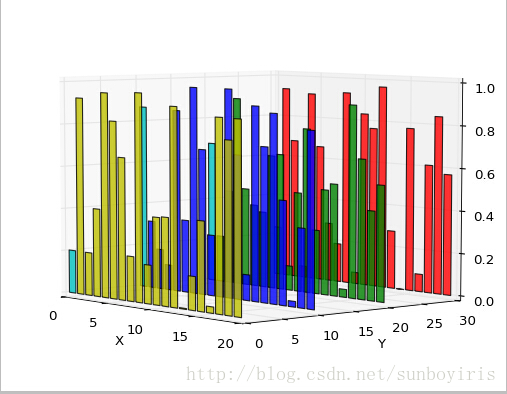
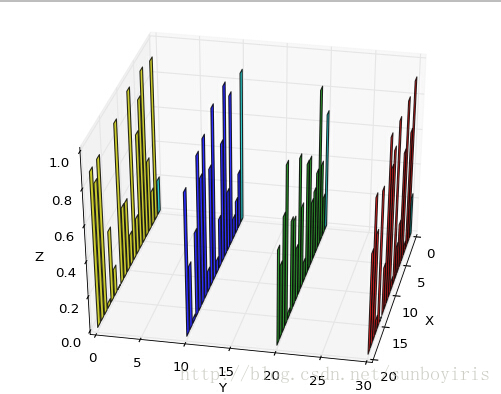
以上为三个方向视图。
最后
以上就是难过纸鹤最近收集整理的关于Python编程-matplotlib3D直方图绘制的全部内容,更多相关Python编程-matplotlib3D直方图绘制内容请搜索靠谱客的其他文章。
本图文内容来源于网友提供,作为学习参考使用,或来自网络收集整理,版权属于原作者所有。


发表评论 取消回复