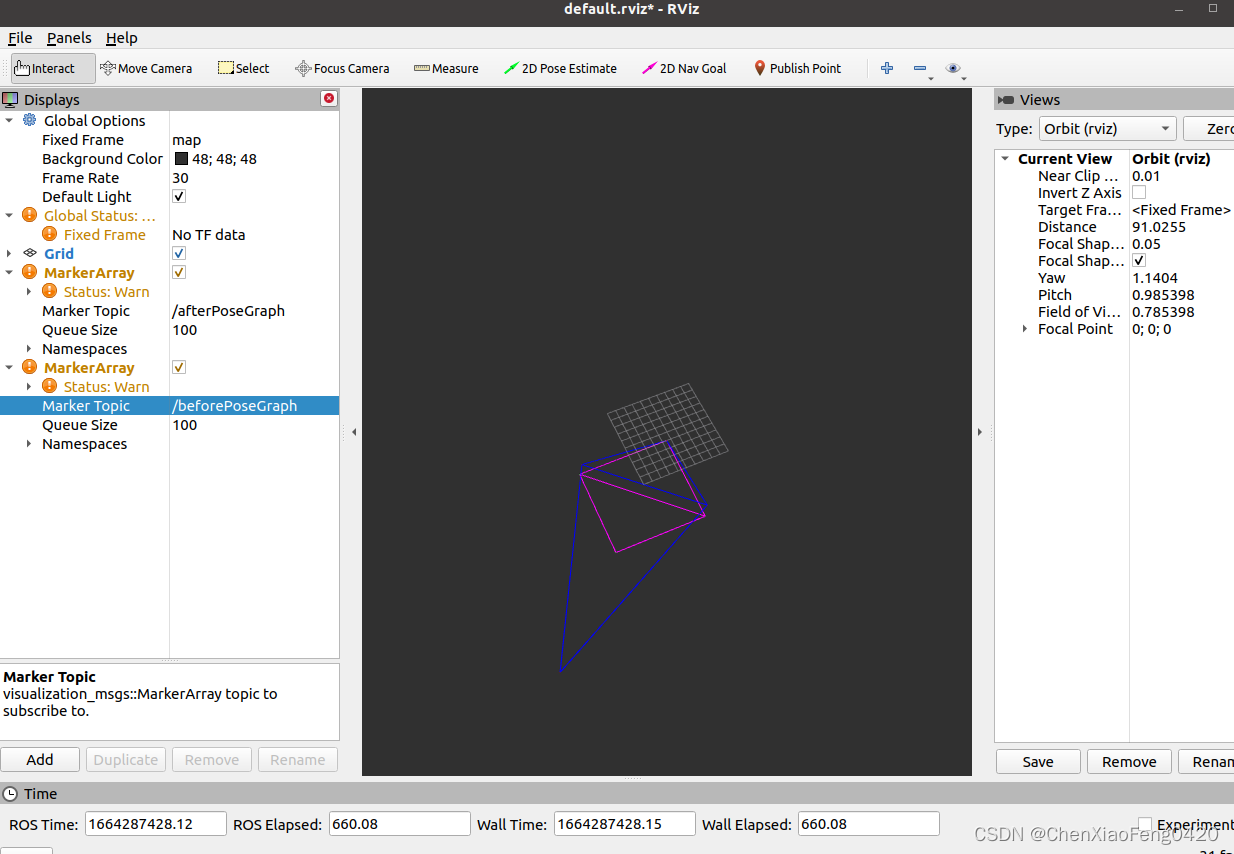
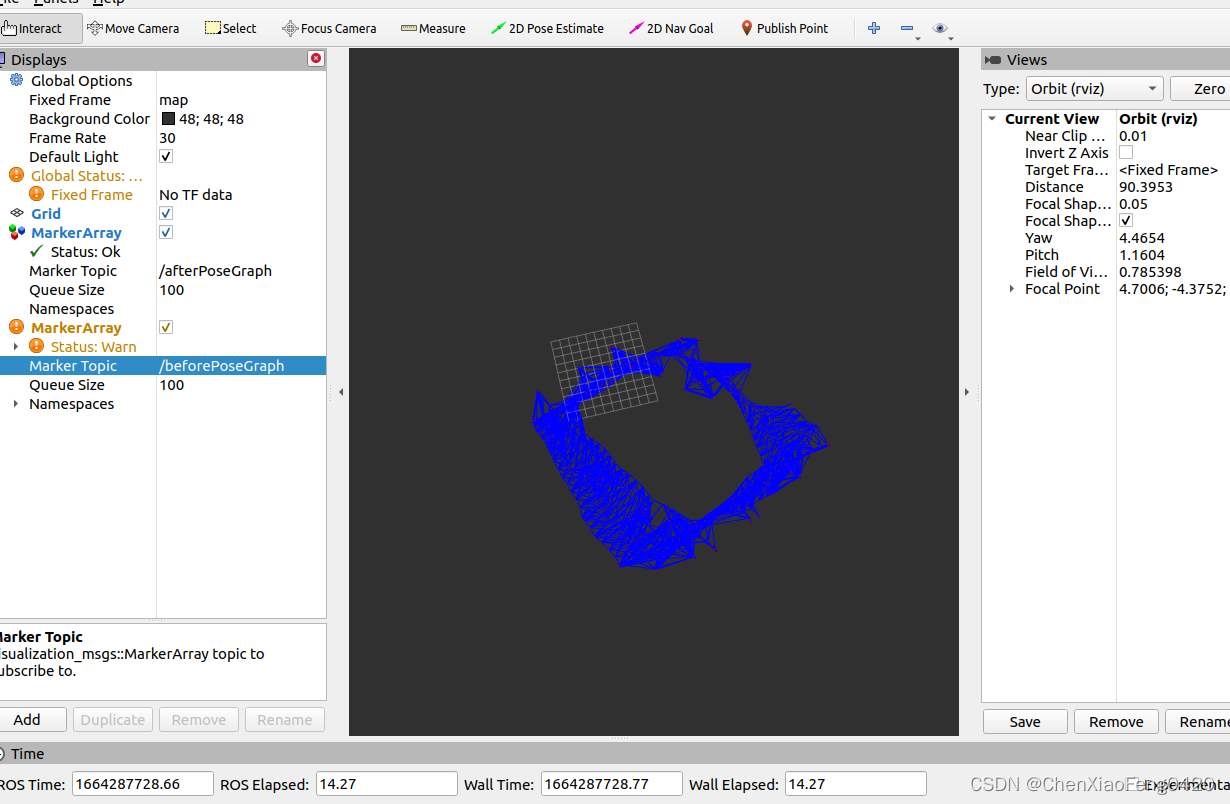
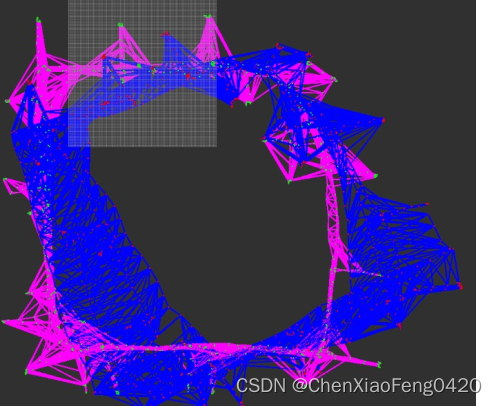
将文件中 kinetic 部分替换为 noetic
按照 PA6.PDF 中进行运行
gaussian_newton.cpp
block 矩阵操作
块操作 构建动态大小子矩阵 提取块大小为(p,q),起始于(i,j) matrix.block(i,j,p,q)
第一段:76-100 lines
void CalcJacobianAndError(Eigen::Vector3d xi,Eigen::Vector3d xj,Eigen::Vector3d z,
                          Eigen::Vector3d& ei,Eigen::Matrix3d& Ai,Eigen::Matrix3d& Bi)
{
    //TODO--Start

    Eigen::Matrix2d RijT;
    RijT << cos(z(2)),sin(z(2)),
        -sin(z(2)),cos(z(2));
    Eigen::Matrix2d RiT;
    RiT << cos(xi(2)),sin(xi(2)),
        -sin(xi(2)),cos(xi(2));
    Eigen::Matrix2d dRiT;
    dRiT << -sin(xi(2)), cos(xi(2)),
            -cos(xi(2)),-sin(xi(2));

    ei.block(0, 0, 2, 1) = RijT * (RiT * (xj.block(0, 0, 2, 1) - xi.block(0, 0, 2, 1)) - z.block(0, 0, 2, 1));
    ei(2) = xj(2) - xi(2) - z(2);
    if (ei(2) > M_PI)
        ei(2) -= 2 * M_PI;
    else if (ei(2) < -M_PI)
        ei(2) += 2 * M_PI;
    Ai.block(0, 0, 2, 2) = - RijT * RiT;
    Ai.block(0, 2, 2, 1) = RijT * dRiT * (xj.block(0, 0, 2, 1) - xi.block(0, 0, 2, 1));
    Ai.block(2, 0, 1, 3) << 0, 0, -1;
    Bi.setIdentity();
    Bi.block(0, 0, 2, 2) = RijT * RiT;
    //TODO--end
}
//TODO--Start
b.block(3*tmpEdge.xi, 0, 3, 1) += Ai.transpose() * infoMatrix * ei;
b.block(3*tmpEdge.xj, 0, 3, 1) += Bi.transpose() * infoMatrix * ei;
H.block(3*tmpEdge.xi, 3*tmpEdge.xi, 3, 3) += Ai.transpose() * infoMatrix * Ai;
H.block(3*tmpEdge.xi, 3*tmpEdge.xj, 3, 3) += Ai.transpose() * infoMatrix * Bi;
H.block(3*tmpEdge.xj, 3*tmpEdge.xi, 3, 3) += Bi.transpose() * infoMatrix * Ai;
H.block(3*tmpEdge.xj, 3*tmpEdge.xj, 3, 3) += Bi.transpose() * infoMatrix * Bi;
//TODO--End dx=H.colPivHouseholderQr().solve(-b);rosrun ls_slam ls_slam 启动运行
紫色为优化后的效果


二、 rviz marker /markerArray使用
RVIZ提供了两种官方支持的RVIZ可视化插件,分别是rviz_marker和rviz_marker_array, 作用是显示一些圆形,圆柱等可视化marker,前者是一次显示一个marker对象,后者是一次显示一系列的marker对象。
具体使用方法可以见ROS tutorial: https://wiki.ros.org/rviz/Tutorials/Markers%3A%20Points%20and%20Lines
代码中主要使用visualization_msgs 进行创建
void PublishGraphForVisulization(ros::Publisher* pub,
                                 std::vector<Eigen::Vector3d>& Vertexs,
                                 std::vector<Edge>& Edges,
                                 int color = 0)
{
    visualization_msgs::MarkerArray marray;

    //point--red
    visualization_msgs::Marker m;
    m.header.frame_id = "map";
    m.header.stamp = ros::Time::now();
    m.id = 0;
    m.ns = "ls-slam";
    m.type = visualization_msgs::Marker::SPHERE;
    m.pose.position.x = 0.0;
    m.pose.position.y = 0.0;
    m.pose.position.z = 0.0;
    m.scale.x = 0.1;
    m.scale.y = 0.1;
    m.scale.z = 0.1;

    if(color == 0)
    {
        m.color.r = 1.0;
        m.color.g = 0.0;
        m.color.b = 0.0;
    }
    else
    {
        m.color.r = 0.0;
        m.color.g = 1.0;
        m.color.b = 0.0;
    }

    m.color.a = 1.0;
    m.lifetime = ros::Duration(0);

    //linear--blue
    visualization_msgs::Marker edge;
    edge.header.frame_id = "map";
    edge.header.stamp = ros::Time::now();
    edge.action = visualization_msgs::Marker::ADD;
    edge.ns = "karto";
    edge.id = 0;
    edge.type = visualization_msgs::Marker::LINE_STRIP;
    edge.scale.x = 0.1;
    edge.scale.y = 0.1;
    edge.scale.z = 0.1;

    if(color == 0)
    {
        edge.color.r = 0.0;
        edge.color.g = 0.0;
        edge.color.b = 1.0;
    }
    else
    {
        edge.color.r = 1.0;
        edge.color.g = 0.0;
        edge.color.b = 1.0;
    }
    edge.color.a = 1.0;

    m.action = visualization_msgs::Marker::ADD;
    uint id = 0;

    //加入节点
    for (uint i=0; i<Vertexs.size(); i++)
    {
        m.id = id;
        m.pose.position.x = Vertexs[i](0);
        m.pose.position.y = Vertexs[i](1);
        marray.markers.push_back(visualization_msgs::Marker(m));
        id++;
    }

    //加入边
    for(int i = 0; i < Edges.size();i++)
    {
        Edge tmpEdge = Edges[i];
        edge.points.clear();

        geometry_msgs::Point p;
        p.x = Vertexs[tmpEdge.xi](0);
        p.y = Vertexs[tmpEdge.xi](1);
        edge.points.push_back(p);

        p.x = Vertexs[tmpEdge.xj](0);
        p.y = Vertexs[tmpEdge.xj](1);
        edge.points.push_back(p);
        edge.id = id;

        marray.markers.push_back(visualization_msgs::Marker(edge));
        id++;
    }

    pub->publish(marray);
}
最后
以上就是怕孤单钢铁侠最近收集整理的关于激光slam 第六次作业的全部内容,更多相关激光slam内容请搜索靠谱客的其他文章。
本图文内容来源于网友提供,作为学习参考使用,或来自网络收集整理,版权属于原作者所有。


发表评论 取消回复