@Bean
public ServletRegistrationBean getServlet() {
HystrixMetricsStreamServlet streamServlet = new HystrixMetricsStreamServlet();
ServletRegistrationBean registrationBean = new ServletRegistrationBean(streamServlet);
registrationBean.setLoadOnStartup(1);
registrationBean.addUrlMappings("/actuator/hystrix.stream");
registrationBean.setName(“HystrixMetricsStreamServlet”);
return registrationBean;
}
启动eureka-server,eureka-client,eureka-client-riibon,浏览器请求http://localhost:8795/hystrix
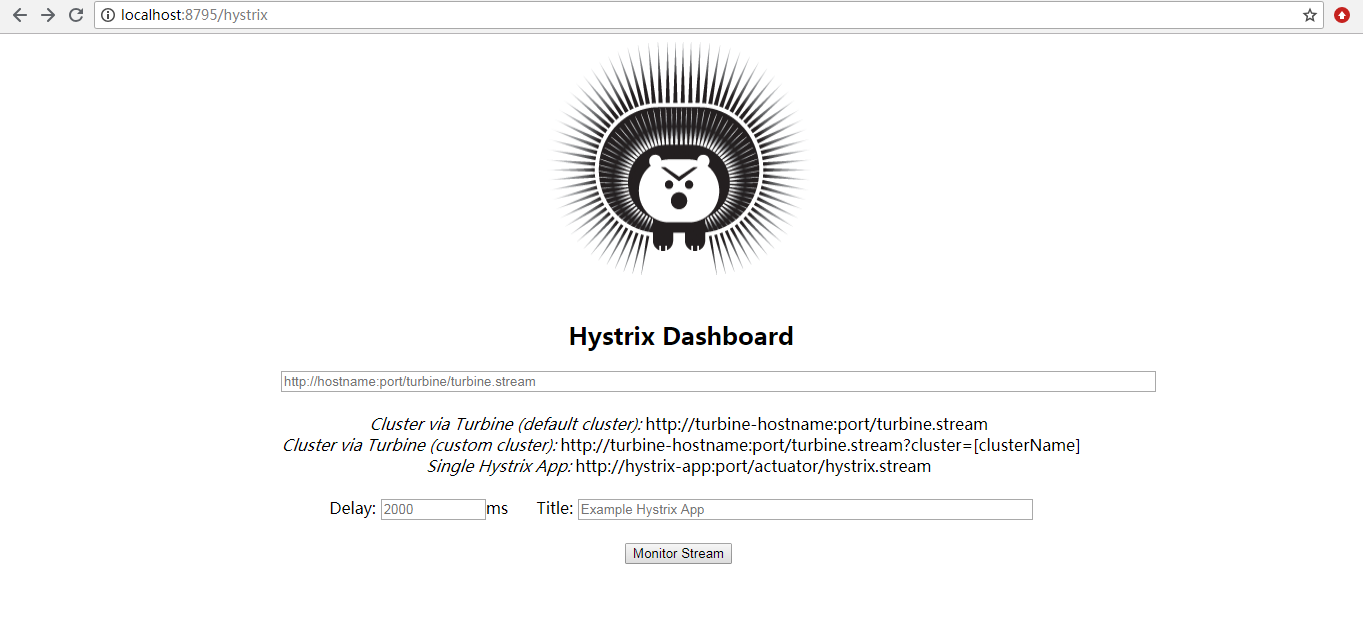
在界面上分别输入http://localhost:8795/actuator/hystrix.stream,2000,ribbon,点击Monitor Stream,界面出现两个loading。。。请求http://localhost:8795/main调用eureka-clien
【一线大厂Java面试题解析+后端开发学习笔记+最新架构讲解视频+实战项目源码讲义】

浏览器打开:qq.cn.hn/FTf 免费领取
t中的服务。
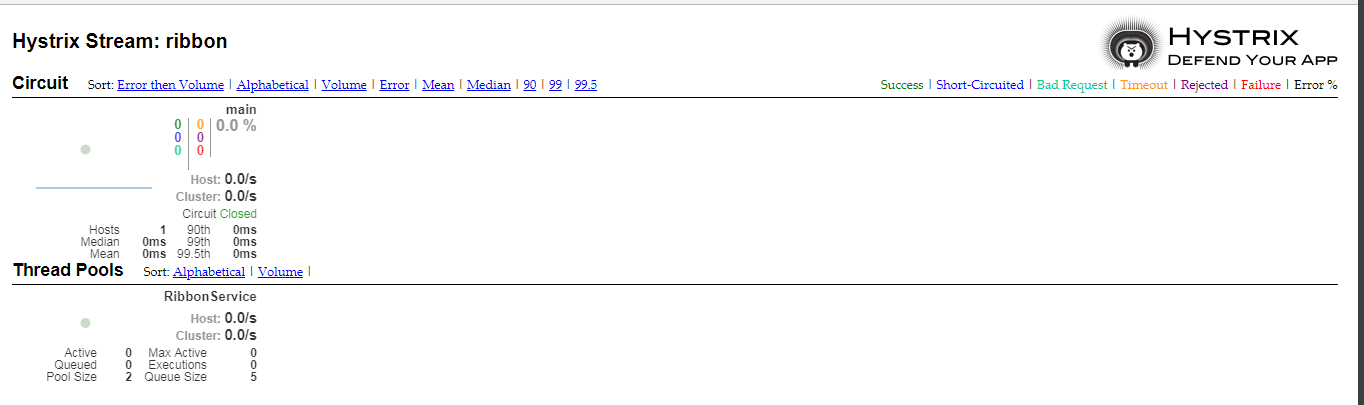
界面如上图。多次点击后灰色的小圆圈会变大,直线会上扬,具体效果自己验证。
在feign中的配置与ribbon 相同,这里不再赘述。
使用Turbine 中聚合监控
===============
在使用 Hystrix Dashboard组件监控服务的熔断器状况时,每个服务都有Dashboard主页,当服务数量很多时,监控非常不方便。为了同时监控多个服务的熔断器的状Turbine用于聚合多个 Hystrix Dashboard, Netflix开源了 Hystrix的另一个组件 Turbine
将多个 Hystrix Dashboard组件的数据放在一个页面上展示,进行集中监控。
创建新的Module eureka-monitor-client
pom.xml如下:
<?xml version="1.0" encoding="UTF-8"?><project xmlns=“http://maven.apache.org/POM/4.0.0” xmlns:xsi=“http://www.w3.org/2001/XMLSchema-instance”
xsi:schemaLocation=“http://maven.apache.org/POM/4.0.0 http://maven.apache.org/xsd/maven-4.0.0.xsd”>
4.0.0
com.springcloud.demo
springcloud-demo
1.0-SNAPSHOT
eureka-monitor-client
0.0.1-SNAPSHOT
jar
eureka-monitor-client
Demo project for Spring Boot
org.springframework.boot
spring-boot-starter-actuator
org.springframework.cloud
spring-cloud-starter-netflix-turbine
org.springframework.boot
spring-boot-starter-test
test
org.springframework.boot
spring-boot-maven-plugin
增加配置端口为8796:
server.port=8796
spring.application.name=service-turbine
eureka.client.service-url.defaultZone=http://localhost:8791/eureka/
turbine.aggregator.cluster-config=default
turbine.app-config=eureka-client-feign,eureka-client-ribbon
turbine.cluster-name-expression=new String(“default”)
在EurekaMonitorClientApplication 上添加注解@EnableTurbine
@EnableTurbine
@SpringBootApplication
public class EurekaMonitorClientApplication {
public static void main(String[] args) {
SpringApplication.run(EurekaMonitorClientApplication.class, args);
最后
以上就是危机超短裙最近收集整理的关于Spring Cloud入门教程-使用Hystrix Dashboard 监控熔断器的状态的全部内容,更多相关Spring内容请搜索靠谱客的其他文章。


发表评论 取消回复