原文出处
https://wiki.woodpecker.org.cn/moin/MiscItems/2011-08-24
代码结果
代码实现
# -*- coding: utf-8 -*-
"""
Created on Mon Mar 5 13:41:09 2018
"""
'''
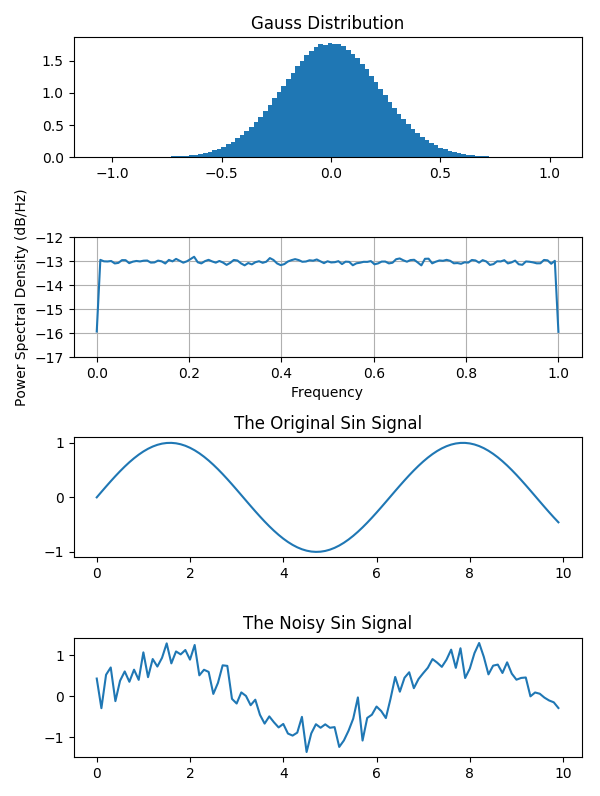
SNR = [-4,-2,0,2,4,6,8,10](dB)
SNR = 10*log10( sum(x**2) / sum(n**2))
程序中用hist()检查噪声是否是高斯分布,psd()检查功率谱密度是否为常数。
'''
import numpy as np
import pylab as plt
def wgn(x, snr):
snr = 10**(snr/10.0)
xpower = np.sum(x**2)/len(x)
npower = xpower / snr
return np.random.randn(len(x)) * np.sqrt(npower)
def wgn_matrix(X, snr):
snr = 10**(snr/10.0)
xpower = np.sum(X**2,axis=1)/X.shape[1]
npowers = xpower / snr
noise_arr = np.ones(X.shape)
for n, npower in enumerate(npowers):
noise_arr[n,:]=np.random.randn(X.shape[1]) * np.sqrt(npower)
return noise_arr
t = np.arange(0, 1000000) * 0.1
x = np.sin(t)
snr = 10
n = wgn(x, snr)
xn = x+n # 增加了6dBz信噪比噪声的信号
plt.figure(figsize=(6,8))
plt.subplot(411)
plt.title('Gauss Distribution')
plt.hist(n, bins=100, normed=True)
plt.subplot(412)
plt.psd(n)
plt.subplot(413)
plt.plot(t[0:100],x[0:100])
plt.title('The Original Sin Signal')
plt.subplot(414)
plt.plot(t[0:100],xn[0:100])
plt.title('The Noisy Sin Signal')
plt.show()
plt.tight_layout()
最后
以上就是感性白云最近收集整理的关于180305 手写python高斯白噪声函数的全部内容,更多相关180305内容请搜索靠谱客的其他文章。
本图文内容来源于网友提供,作为学习参考使用,或来自网络收集整理,版权属于原作者所有。


发表评论 取消回复