参考:
- Ubuntu 安装perf
正文:
- 安装 perf
先输入 perf, Command ‘perf’ not found,有对应的安装提示
$ perf

Command 'perf' not found, but can be installed with:

sudo apt install linux-tools-common
$ sudo apt install linux-tools-common
$ perf
WARNING: perf not found for kernel 5.4.0-107

  You may need to install the following packages for this specific kernel:
    linux-tools-5.4.0-107-generic
    linux-cloud-tools-5.4.0-107-generic

  You may also want to install one of the following packages to keep up to date:
    linux-tools-generic
    linux-cloud-tools-generic
还是缺少库,装库
$ sudo apt-get install linux-tools-5.4.0-107-generic linux-cloud-tools-5.4.0-107-generic linux-tools-generic linux-cloud-tools-generic
所以 ubuntu 18.04 安装 perf 的所有操作:
$ sudo apt install linux-tools-common
$ sudo apt-get install linux-tools-5.4.0-107-generic linux-cloud-tools-5.4.0-107-generic linux-tools-generic linux-cloud-tools-generic
安装成功:
$ perf

 usage: perf [--version] [--help] [OPTIONS] COMMAND [ARGS]

 The most commonly used perf commands are:
   annotate        Read perf.data (created by perf record) and display annotated code
   archive         Create archive with object files with build-ids found in perf.data file
   bench           General framework for benchmark suites
   buildid-cache   Manage build-id cache.
   buildid-list    List the buildids in a perf.data file
   c2c             Shared Data C2C/HITM Analyzer.
   config          Get and set variables in a configuration file.
   data            Data file related processing
   diff            Read perf.data files and display the differential profile
   evlist          List the event names in a perf.data file
   ftrace          simple wrapper for kernel's ftrace functionality
   inject          Filter to augment the events stream with additional information
   kallsyms        Searches running kernel for symbols
   kmem            Tool to trace/measure kernel memory properties
   kvm             Tool to trace/measure kvm guest os
   list            List all symbolic event types
   lock            Analyze lock events
   mem             Profile memory accesses
   record          Run a command and record its profile into perf.data
   report          Read perf.data (created by perf record) and display the profile
   sched           Tool to trace/measure scheduler properties (latencies)
   script          Read perf.data (created by perf record) and display trace output
   stat            Run a command and gather performance counter statistics
   test            Runs sanity tests.
   timechart       Tool to visualize total system behavior during a workload
   top             System profiling tool.
   version         display the version of perf binary
   probe           Define new dynamic tracepoints
   trace           strace inspired tool

 See 'perf help COMMAND' for more information on a specific command.
 $ perf --version
perf version 5.4.174
- 使用 perf
perf 按照固定的频率去“采样”,然后再统计函数的调用次数,算出百分比。只要采样的频率足够大,把这些“瞬时截面”组合在一起,就可以得到进程运行时的可信数据,比较全面地描述出 CPU 使用情况。
输入 top 查看进程的 PID 号
$ sudo perf top -K -p 3213 (PID)
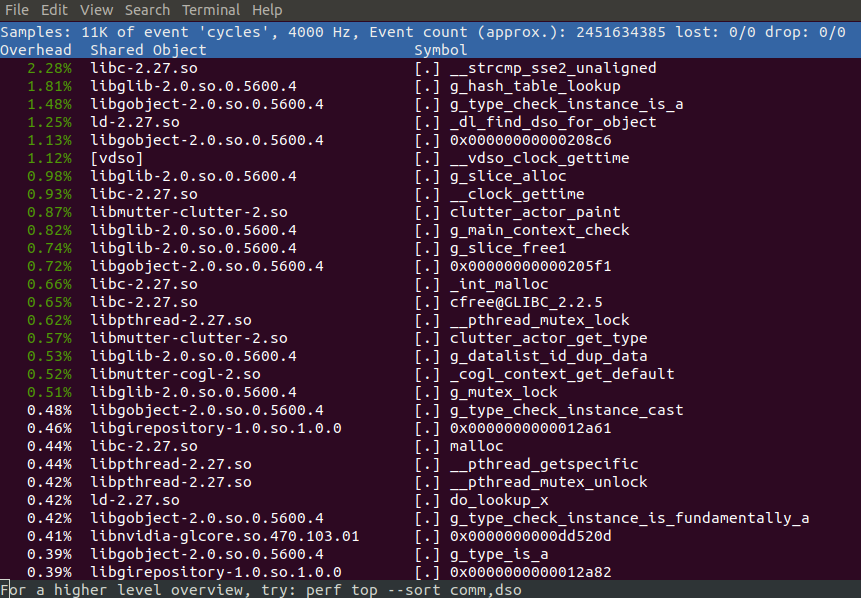
查看最大cpu 占用率对应的库的函数,然后进行优化
使用 perf 通常可以快速定位系统的瓶颈,帮助找准性能优化的方向。
最后
以上就是聪慧棉花糖最近收集整理的关于ubuntu18.04 性能分析工具perf的使用的全部内容,更多相关ubuntu18.04内容请搜索靠谱客的其他文章。
本图文内容来源于网友提供,作为学习参考使用,或来自网络收集整理,版权属于原作者所有。


发表评论 取消回复