之前没有接触WinDbg,现在发现真乃神器啊,今天就来简单学习一下分析崩溃转储文件。毕竟是才接触Windbg,懂的命令也不是特别多,所以还是依靠自动分析命令。
拓展命令analyze是一种自动分析故障的方式,它的目标是实现对故障的自动分析以及对已知问题的自动检测和分派。
-v开关对信息进行详细输出,-hang开关则是对问题进行自动分析。
刚好手边有一份Dmp文件,索性拿来先简单学习一下。可能理解的有问题,也请大家指教。
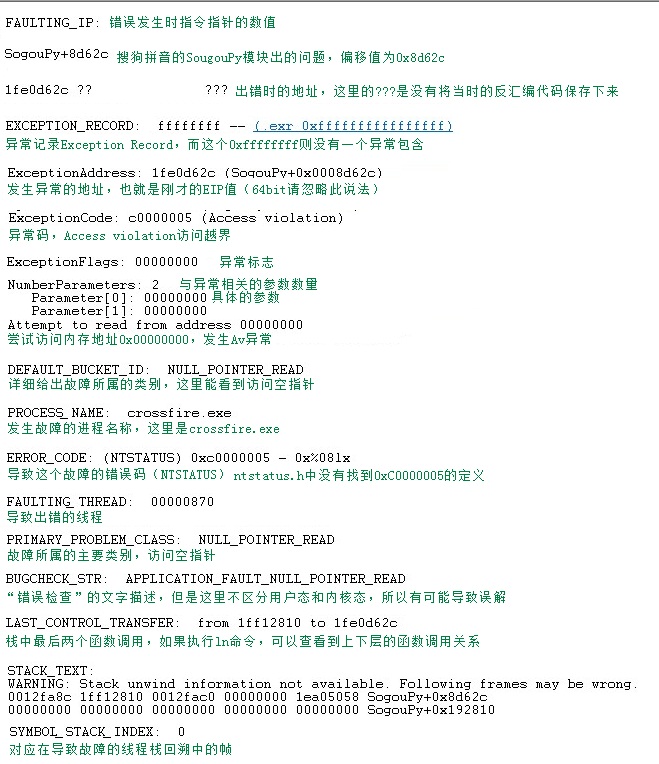
对于这份Dmp的主要内容在图中都已经进行了说明。但是每一份Dmp都不同,可能侧重点也就不同,这里分析出为搜狗拼音模块注入进CF,但是发生了访问空指针的行为,导致CF崩溃。
可能一上来就说Dmp分析出的内容,有点不好接收,下面我也作为一个初学者,一点点来学习Dmp分析。
在学习C语言的时候,就知道整数不能跟0进行除运算,否则会引起程序崩溃。
#include <windows.h>int WINAPI WinMain( __in HINSTANCE hInstance, __in_opt HINSTANCE hPrevInstance, __in_opt LPSTR lpCmdLine, __in int nShowCmd ){ int i = 10; int j = 0; int res = 0; return res = i/j;}
上面就写一个能触发除0异常,导致程序结束运行的程序。
如何能拿到所谓的崩溃转储文件呢?可以通过调试器的dump命令,但是这次使用Windbg工具箱中的adplus.vbs来抓取dmp。ADPlus能够检测一个或多个进程,并且在这些进程发生崩溃时自动生成转储文件并通知用户。
但是现在模拟一个存在异常的程序已经给了用户,用户出现程序崩溃,开发人员也无法直接去用户现场调试,更不肯能让用户安装Windbg使用其中的工具来抓取dmp。
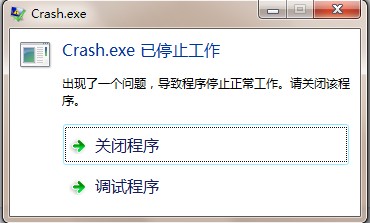
就只有通过系统自带的Dr.Watson了,由于另外一台机器上使用过OllyDbg,所以需要使用drwtsn32 -i,将Dr.Watson设置为默认应用程序调试程序。
之后用户运行Crash.exe,就会出现转储文件。之后使用!analyze进行自动分析。
Windows XP Version 2600 (Service Pack 3) MP (4 procs) Free x86 compatibleProduct: WinNt, suite: SingleUserTSMachine Name:Debug session time: Tue May 15 21:42:21.000 2012 (GMT+8)System Uptime: not availableProcess Uptime: 0 days 0:00:03.000.............This dump file has an exception of interest stored in it.The stored exception information can be accessed via .ecxr.(cc0.cc4): Integer divide-by-zero - code c0000094 (first/second chance not available)eax=0000000a ebx=7ffd4000 ecx=7c802413 edx=00000000 esi=00000000 edi=00000000eip=0040102a esp=0012ff28 ebp=0012ff34 iopl=0 nv up ei pl zr na pe nccs=001b ss=0023 ds=0023 es=0023 fs=003b gs=0000 efl=00000246*** WARNING: Unable to verify checksum for Crash.exe*** ERROR: Module load completed but symbols could not be loaded for Crash.exeCrash+0x102a:0040102a f77df4 idiv eax,dword ptr [ebp-0Ch] ss:0023:0012ff28=000000000:000> !analyze -v -hang******************************************************************************** ** Exception Analysis ** ************************************************************************************************************************************************************ ****** ****** Your debugger is not using the correct symbols ****** ****** In order for this command to work properly, your symbol path ****** must point to .pdb files that have full type information. ****** ****** Certain .pdb files (such as the public OS symbols) do not ****** contain the required information. Contact the group that ****** provided you with these symbols if you need this command to ****** work. ****** ****** Type referenced: kernel32!pNlsUserInfo ****** ******************************************************************************************************************************************************** ****** ****** Your debugger is not using the correct symbols ****** ****** In order for this command to work properly, your symbol path ****** must point to .pdb files that have full type information. ****** ****** Certain .pdb files (such as the public OS symbols) do not ****** contain the required information. Contact the group that ****** provided you with these symbols if you need this command to ****** work. ****** ****** Type referenced: kernel32!pNlsUserInfo ****** ****************************************************************************FAULTING_IP: Crash+102a0040102a f77df4 idiv eax,dword ptr [ebp-0Ch]EXCEPTION_RECORD: ffffffff -- (.exr 0xffffffffffffffff)ExceptionAddress: 0040102a (Crash+0x0000102a) ExceptionCode: c0000094 (Integer divide-by-zero) ExceptionFlags: 00000000NumberParameters: 0BUGCHECK_STR: HANGPROCESS_NAME: Crash.exeERROR_CODE: (NTSTATUS) 0xcfffffff - <Unable to get error code text>EXCEPTION_CODE: (NTSTATUS) 0xcfffffff - <Unable to get error code text>DERIVED_WAIT_CHAIN: Dl Eid Cid WaitType-- --- ------- -------------------------- 0 cc0.cc4 Unknown WAIT_CHAIN_COMMAND: ~0s;k;;BLOCKING_THREAD: 00000cc4DEFAULT_BUCKET_ID: APPLICATION_HANG_BusyHangPRIMARY_PROBLEM_CLASS: APPLICATION_HANG_BusyHangLAST_CONTROL_TRANSFER: from 00401107 to 0040102aFAULTING_THREAD: 00000000STACK_TEXT: WARNING: Stack unwind information not available. Following frames may be wrong.0012ff34 00401107 00400000 00000000 001423c9 Crash+0x102a0012ffc0 7c817077 00000000 03bb65b0 7ffd4000 Crash+0x11070012fff0 00000000 00401039 00000000 00000000 kernel32!BaseProcessStart+0x23FOLLOWUP_IP: Crash+110700401107 8945a0 mov dword ptr [ebp-60h],eaxSYMBOL_STACK_INDEX: 1SYMBOL_NAME: Crash+1107FOLLOWUP_NAME: MachineOwnerMODULE_NAME: CrashIMAGE_NAME: Crash.exeDEBUG_FLR_IMAGE_TIMESTAMP: 4fb258c7STACK_COMMAND: ~0s ; kbBUCKET_ID: HANG_Crash+1107FAILURE_BUCKET_ID: APPLICATION_HANG_BusyHang_cfffffff_Crash.exe!UnknownWATSON_STAGEONE_URL: http://watson.microsoft.com/StageOne/Crash_exe/0_0_0_0/4fb258c7/Crash_exe/0_0_0_0/4fb258c7/cfffffff/0000102a.htm?Retriage=1Followup: MachineOwner---------
其中比较有用的信息有如下两条,第一条明确指出,异常代码,整数除零。
ExceptionCode: c0000094 (Integer divide-by-zero)
第二条则是崩溃时的栈信息,从WinDbg的分析来看,问题发生在Crash基址偏移0x102a的位置。
STACK_TEXT:
WARNING: Stack unwind information not available. Following frames may be wrong.
0012ff34 00401107 00400000 00000000 001423c9 Crash+0x102a
0012ffc0 7c817077 00000000 03bb65b0 7ffd4000 Crash+0x1107
0012fff0 00000000 00401039 00000000 00000000 kernel32!BaseProcessStart+0x23
拿出更熟悉的调试器OllyDbg,找到相关地址,一看便知。
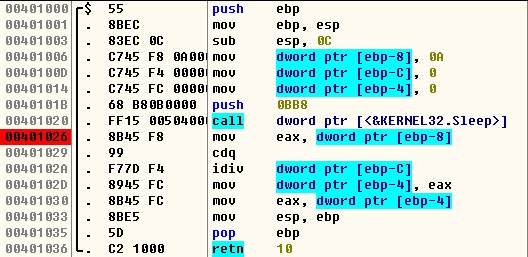
结合之前的代码,0x0040102a执行的是带符号除法指令,而操作数ptr [ebp-C]刚好是之前mov指令传递进来的0,所以eax/0,就出触发异常。
这样也基本定位到了问题的所在,只需要处理掉错误的代码便可。今天的文章写的有点匆忙,也有点口语化,权当一篇笔记吧回头再整理。
最后
以上就是冷静秀发最近收集整理的关于WinDbg 调试dmp文件的全部内容,更多相关WinDbg内容请搜索靠谱客的其他文章。


![[转载]定位程序Crash常用工具和方法](https://www.shuijiaxian.com/files_image/reation/bcimg20.png)


发表评论 取消回复