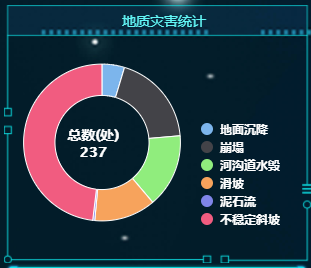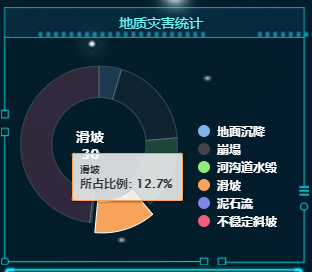

几个注意点:
- 将highcharts绑定的数据设置为计算属性,使用computed对数据进行监听
- 在饼图点击事件绑定click的时候,如果使用function进行绑定,则无法使用this获取组件中的数据,因此使用箭头函数。箭头函数没有作用域
click: (e) => {
// 更改内容标题
  if (e["point"]["sliced"]) {
    // 如果是收起来,显示总数据量
    this.chartTitle = `<span>总数(处)<br>${this.hazardPointTotal}</span>`;
  } else {
    // 如果是打开,显示每类灾害数据量
    this.chartTitle = `${e.point.name}<br>${e.point.y}`;
  }
}
<template>
  <div id="compositeLeftTop">
    <highcharts id="comprehensiveHazardPoint" :options="chartOptions"></highcharts>
  </div>
</template>

<script>
// 已引入highcharts
import {Chart} from "highcharts-vue";
import {getDifferentHazardPointNum} from "@/service/api";

export default {
  name: "LeftTop",
  components: {
    highcharts: Chart,
  },
  data() {
    return {
      hazardPointArr: [],
      hazardPointTotal: 0,
      chartTitle: "",
    }
  },
  created() {
    // 请求数据
    this.getHazardPointObj();
  },
  computed: {
    chartOptions() {
      return {
        chart: {
          style: {  // 配置翻页颜色
            fontSize: '12px',
            fontWeight: 'bolder',
            color: '#05CBD1'
          },
          backgroundColor: 'rgba(0,0,0,0)', // 设置背景透明色
          type: 'pie',
          height: 210,
          width: 285
        },
        legend: {
          layout: "vertical", // 垂直显示
          align: "right", // 右对齐
          labelFormatter: function () {
            return `<p style="color: white;">${this.name} </p>`
          }
        },
        credits: {
          enabled: false     //不显示LOGO
        },
        title: {
          floating: true,
          text: this.chartTitle,
          x: -65,
          y: 90,
          style: {
            color: '#ffffff',
            fontSize: '14px'
          },
        },
        tooltip: {
          pointFormat: '{series.name}: <b>{point.percentage:.1f}%</b>'
        },
        plotOptions: {
          pie: {
            center: ['50%', '50%'],
            size: '120%',
            innerSize: '60%',
            allowPointSelect: true, // 是否允许鼠标点击数据点
            cursor: 'pointer',
            dataLabels: {
              enabled: false
            },
            showInLegend: true,
            point: {
              events: {
                click: (e) => {
                  // 更改内容标题
                  if (e["point"]["sliced"]) {
                    // 如果是收起来,显示总数据量
                    this.chartTitle = `<span>总数(处)<br>${this.hazardPointTotal}</span>`;
                  } else {
                    // 如果是打开,显示每类灾害数据量
                    this.chartTitle = `${e.point.name}<br>${e.point.y}`;
                  }
                }
              }
            },
          },
        },
        series: [{
          name: '所占比例',
          colorByPoint: true,
          data: this.hazardPointArr
        }]
      }
    }
  },
  methods: {
    //发起ajax请求,获取当前角色不同灾害点数量
    async getHazardPointObj() {
      let role = "管道"
      // 同步等待获取数据
      let res = await getDifferentHazardPointNum(role);
      if (res.status === 200) {
        // 如果查询成功,将数据给到组件中预设定的数据
        this.hazardPointTotal = res.data.total;
        this.chartTitle = `<span>总数(处)<br>${this.hazardPointTotal}</span>`;
        for (let item of res.data.rows.values()) {
          this.hazardPointArr.push({
            name: item.type,
            y: Number(item.count)
          })
        }
      }
    }
  }
}
</script>

<style lang="scss" scoped>
@import "./../../../../style/universal";

#compositeLeftTop {
  height: $occupy-all;
  width: $occupy-all;
  //background-color: red;
}
</style>
最后
以上就是鲤鱼钢笔最近收集整理的关于Vue:使用highCharts的全部内容,更多相关Vue内容请搜索靠谱客的其他文章。
本图文内容来源于网友提供,作为学习参考使用,或来自网络收集整理,版权属于原作者所有。


发表评论 取消回复