在Python环境下安装PyOpenGL包,实现Python和OpenGL的开发环境。
PyOpenGL工具包的下载地址:https://pypi.python.org/pypi/PyOpenGL/3.0.2
然后双击.exe可执行文件,即可安装。安装程序会自动搜索到Python的安装目录,并且安装在与Python相同的目录下。安装过程比较简单。
一个简单的实例如下:
from OpenGL.GL import *
from OpenGL.GLU import *
from OpenGL.GLUT import *
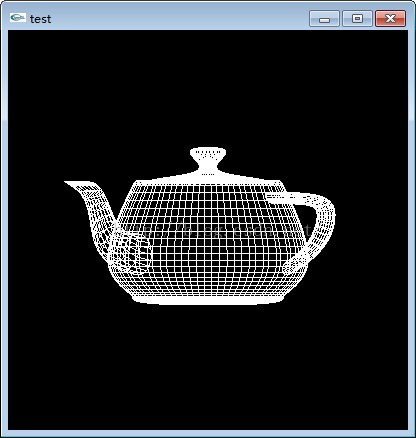
def Draw():
glClear(GL_COLOR_BUFFER_BIT)
glRotatef(0.5, 0, 1, 0)
glutWireTeapot(0.5)
glFlush()
glutInit()
glutInitDisplayMode(GLUT_SINGLE | GLUT_RGBA)
glutInitWindowSize(400, 400)
glutCreateWindow("test")
glutDisplayFunc(Draw)
glutIdleFunc(Draw)
glutMainLoop()
运行结果如下:
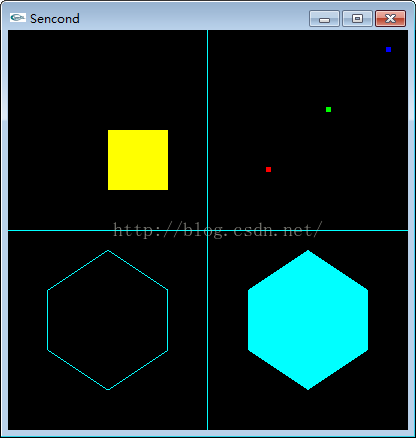
示例二:实现点线面的绘制工作
from OpenGL.GL import *
from OpenGL.GLU import *
from OpenGL.GLUT import *

def init():
    glClearColor(0.0, 0.0, 0.0, 1.0)
    gluOrtho2D(-1.0, 1.0, -1.0, 1.0)

def drawFunc():
    glClear(GL_COLOR_BUFFER_BIT)

    glBegin(GL_LINES)
    glVertex2f(-1.0, 0.0)
    glVertex2f(1.0, 0.0)
    glVertex2f(0.0, 1.0)
    glVertex2f(0.0, -1.0)
    glEnd()

    glPointSize(5.0)
    glBegin(GL_POINTS)
    glColor3f(1.0, 0.0, 0.0)
    glVertex2f(0.3, 0.3)
    glColor3f(0.0, 1.0, 0.0)
    glVertex2f(0.6, 0.6)
    glColor3f(0.0, 0.0, 1.0)
    glVertex2f(0.9, 0.9)
    glEnd()

    glColor3f(1.0, 1.0, 0)
    glBegin(GL_QUADS)
    glVertex2f(-0.2, 0.2)
    glVertex2f(-0.2, 0.5)
    glVertex2f(-0.5, 0.5)
    glVertex2f(-0.5, 0.2)
    glEnd()

    glColor3f(0.0, 1.0, 1.0)
    glPolygonMode(GL_FRONT, GL_LINE)
    glPolygonMode(GL_BACK, GL_FILL)
    glBegin(GL_POLYGON)
    glVertex2f(-0.5, -0.1)
    glVertex2f(-0.8, -0.3)
    glVertex2f(-0.8, -0.6)
    glVertex2f(-0.5, -0.8)
    glVertex2f(-0.2, -0.6)
    glVertex2f(-0.2, -0.3)
    glEnd()

    glPolygonMode(GL_FRONT, GL_FILL)
    glPolygonMode(GL_BACK, GL_LINE)
    glBegin(GL_POLYGON)
    glVertex2f(0.5, -0.1)
    glVertex2f(0.2, -0.3)
    glVertex2f(0.2, -0.6)
    glVertex2f(0.5, -0.8)
    glVertex2f(0.8, -0.6)
    glVertex2f(0.8, -0.3)
    glEnd()

    glFlush()

glutInit()
glutInitDisplayMode(GLUT_RGBA|GLUT_SINGLE)
glutInitWindowSize(400, 400)
glutCreateWindow("Sencond")

glutDisplayFunc(drawFunc)
init()
glutMainLoop()
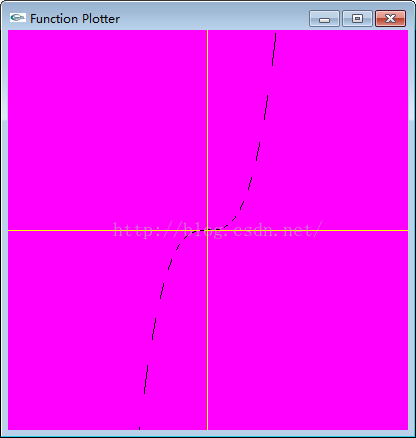
示例3:实现对y=x^3的函数曲线
#导入OpenGL的库
from OpenGL.GL import *
from OpenGL.GLU import *
from OpenGL.GLUT import *
#from numpy import *
import sys

def init():
    #初始化背景
    glClearColor(1.0, 0.0, 1.0, 1.0)
    gluOrtho2D(-5.0, 5.0, -5.0, 5.0)

def plotfunc():
    glClear(GL_COLOR_BUFFER_BIT)
    glPointSize(5.0)

    #绘制坐标系
    glColor3f(1.0, 1.0, 0.0)
    glBegin(GL_LINES) #画线
    glVertex2f(-5.0, 0.0)
    glVertex2f(5.0, 0.0)
    glVertex2f(0.0, 5.0)
    glVertex2f(0.0, -5.0)
    glEnd()

    #绘制y = x*x*x (-5.0 < x < 5.0) 的图像
    glColor3f(0.0, 0.0, 0.0)
    glBegin(GL_LINES)#画线
    #for x in arange(-5.0, 5.0, 0.1):
    for x in (i * 0.1 for i in range(-50, 50)):
        y = x * x * x
        glVertex2f(x, y) #绘制每个0.1个步长的点
    glEnd()

    glFlush()

def main():
    glutInit(sys.argv)
    glutInitDisplayMode(GLUT_SINGLE | GLUT_RGB)
    glutInitWindowPosition(50,50)
    glutInitWindowSize(400,400)
    glutCreateWindow("Function Plotter")
    glutDisplayFunc(plotfunc)
    init()
    glutMainLoop()

main()
运行结果:
最后
以上就是追寻吐司最近收集整理的关于Python环境下安装PyOpenGL的全部内容,更多相关Python环境下安装PyOpenGL内容请搜索靠谱客的其他文章。
本图文内容来源于网友提供,作为学习参考使用,或来自网络收集整理,版权属于原作者所有。


发表评论 取消回复