抓取onenet数据,并通过EXCEL和动态折线图展示
一:onenet建立数据
-
onenet官网:https://open.iot.10086.cn/
-
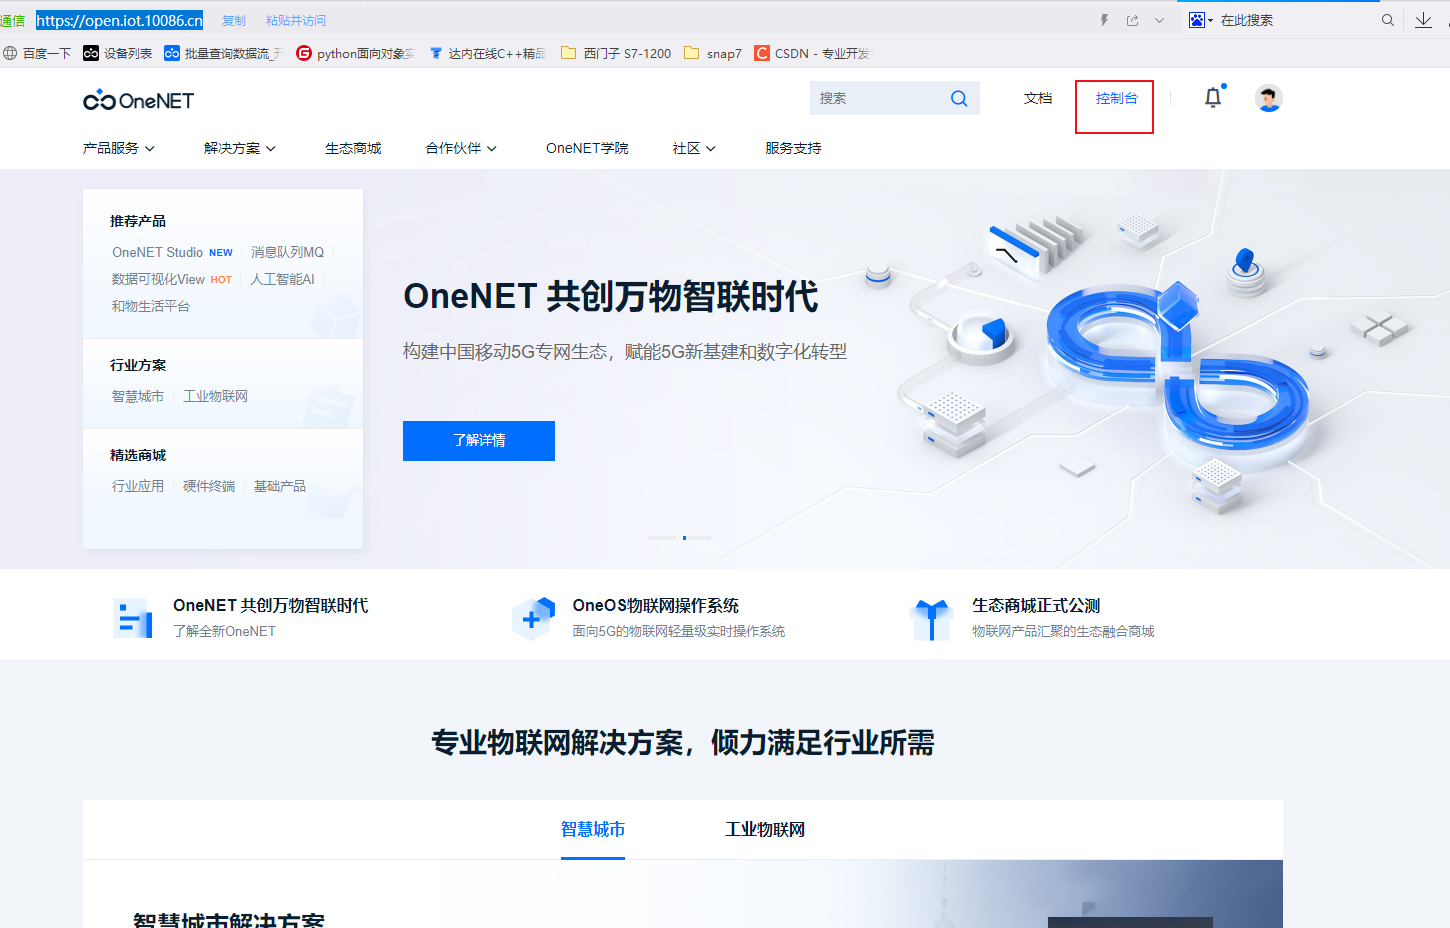
注册登录进入后,点击右上角控制台
-
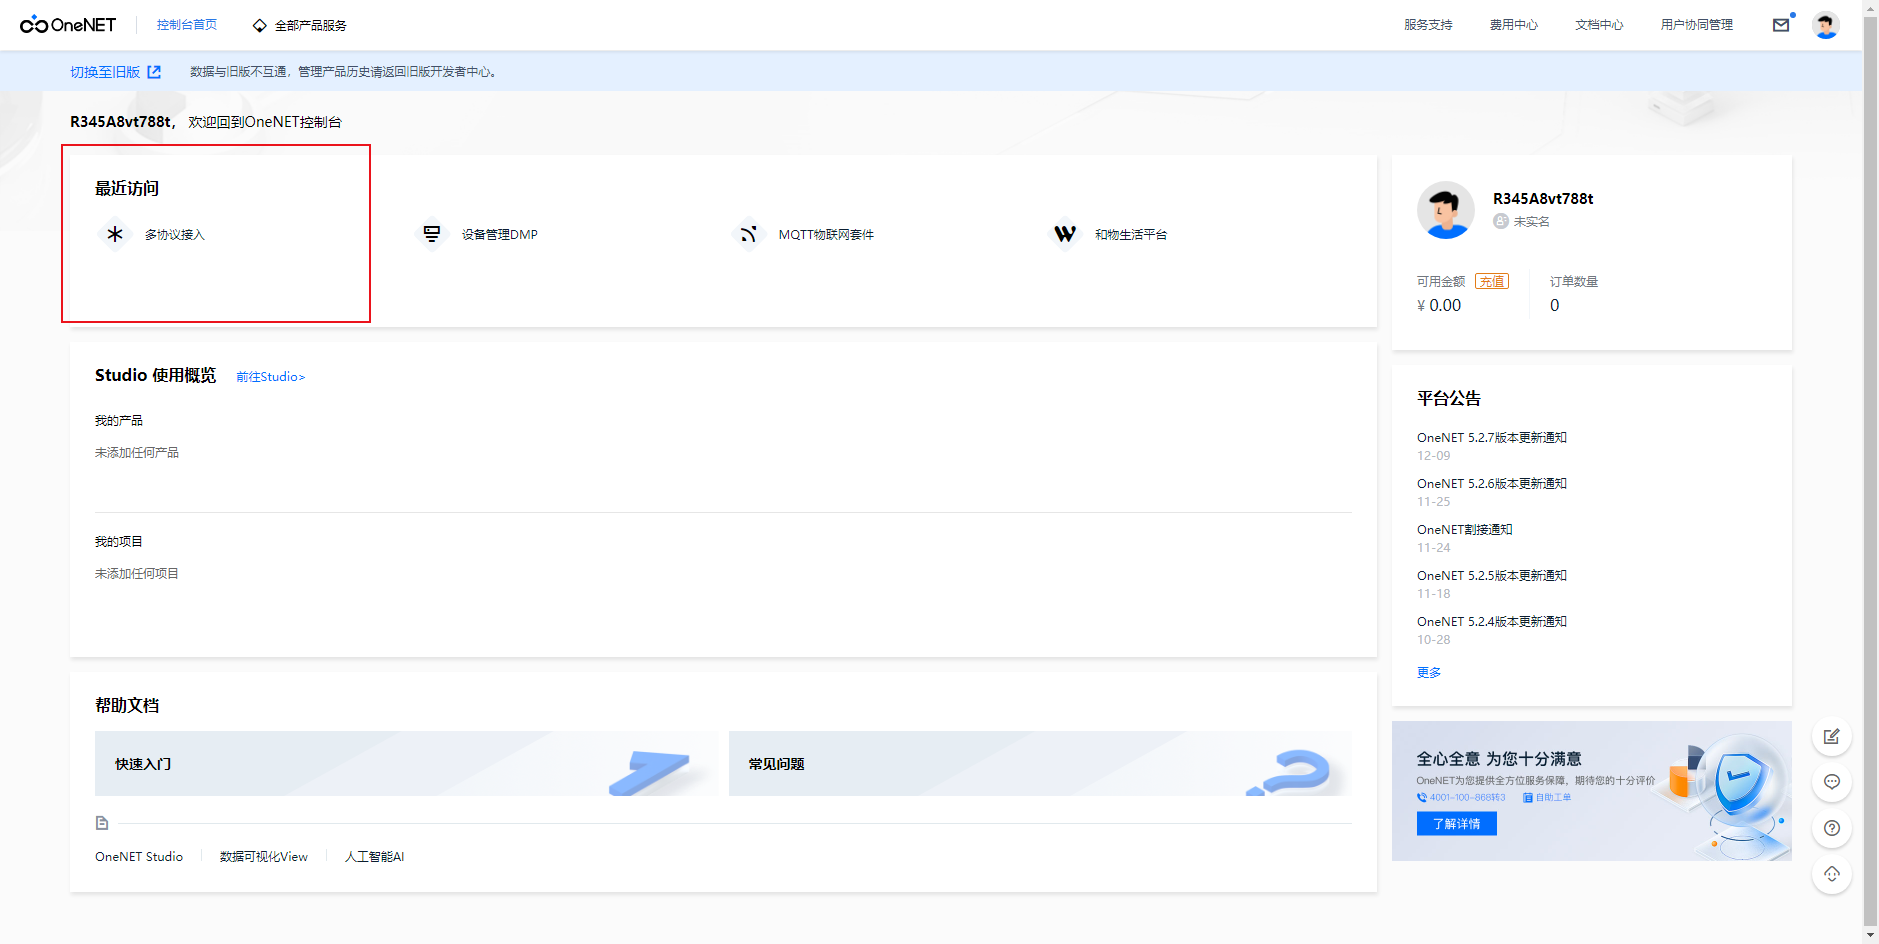
进入控制台界面后,点击多协议接入进入创建产品界面
-
-
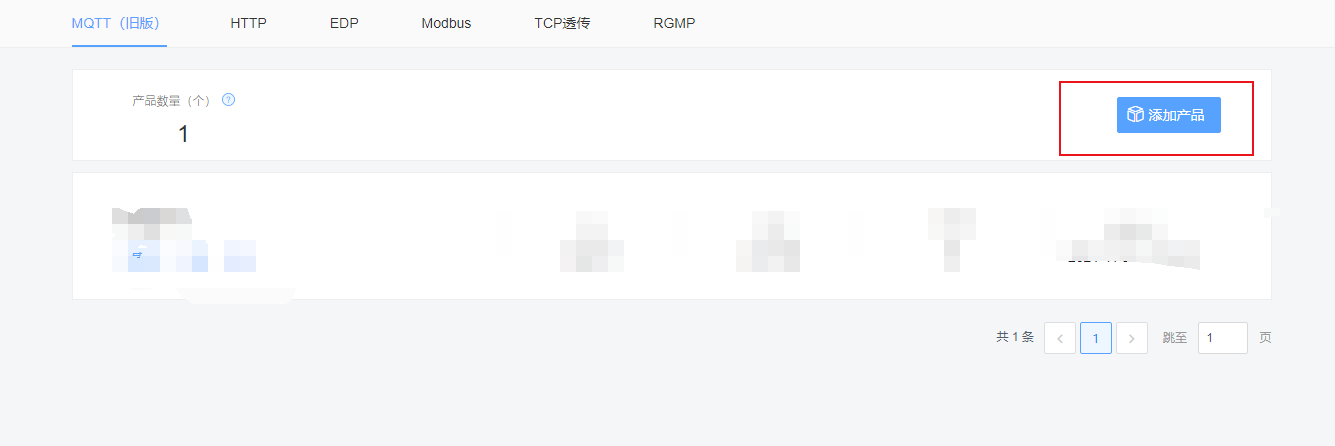
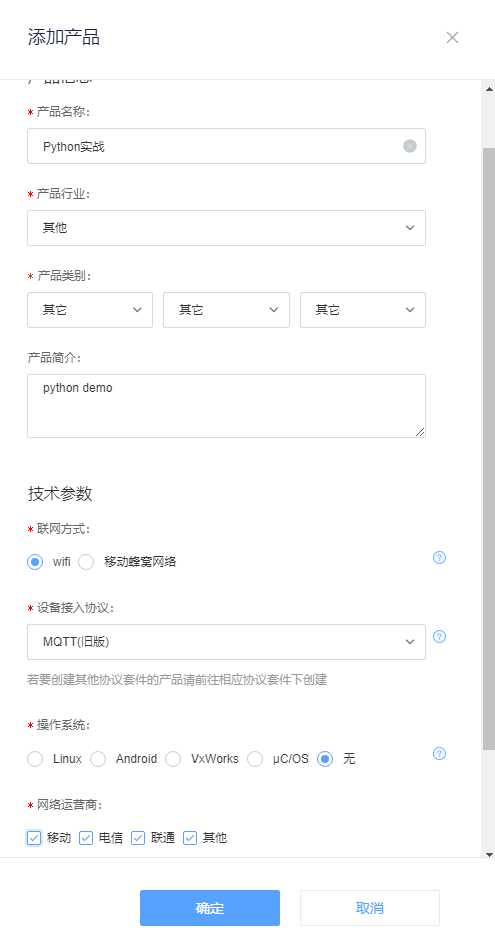
创建产品
-
-
添加设备(若无创建产品提示,在左边边框进入项目后,选择产品列表,添加产品)
-
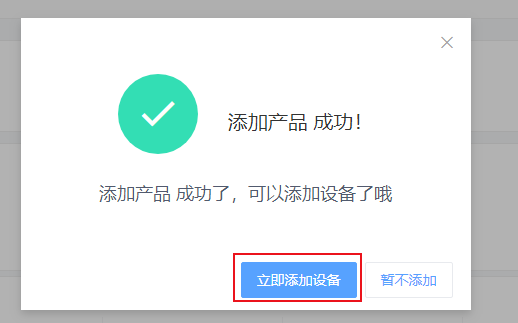
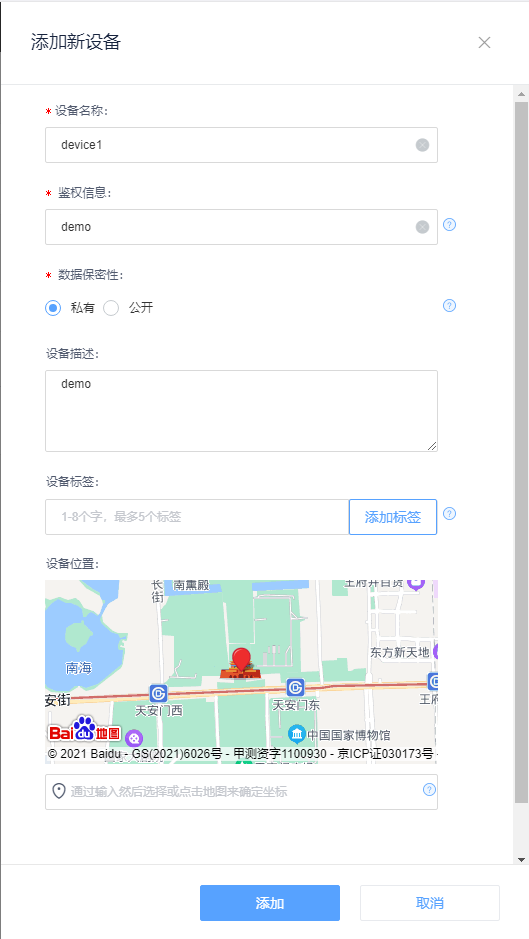
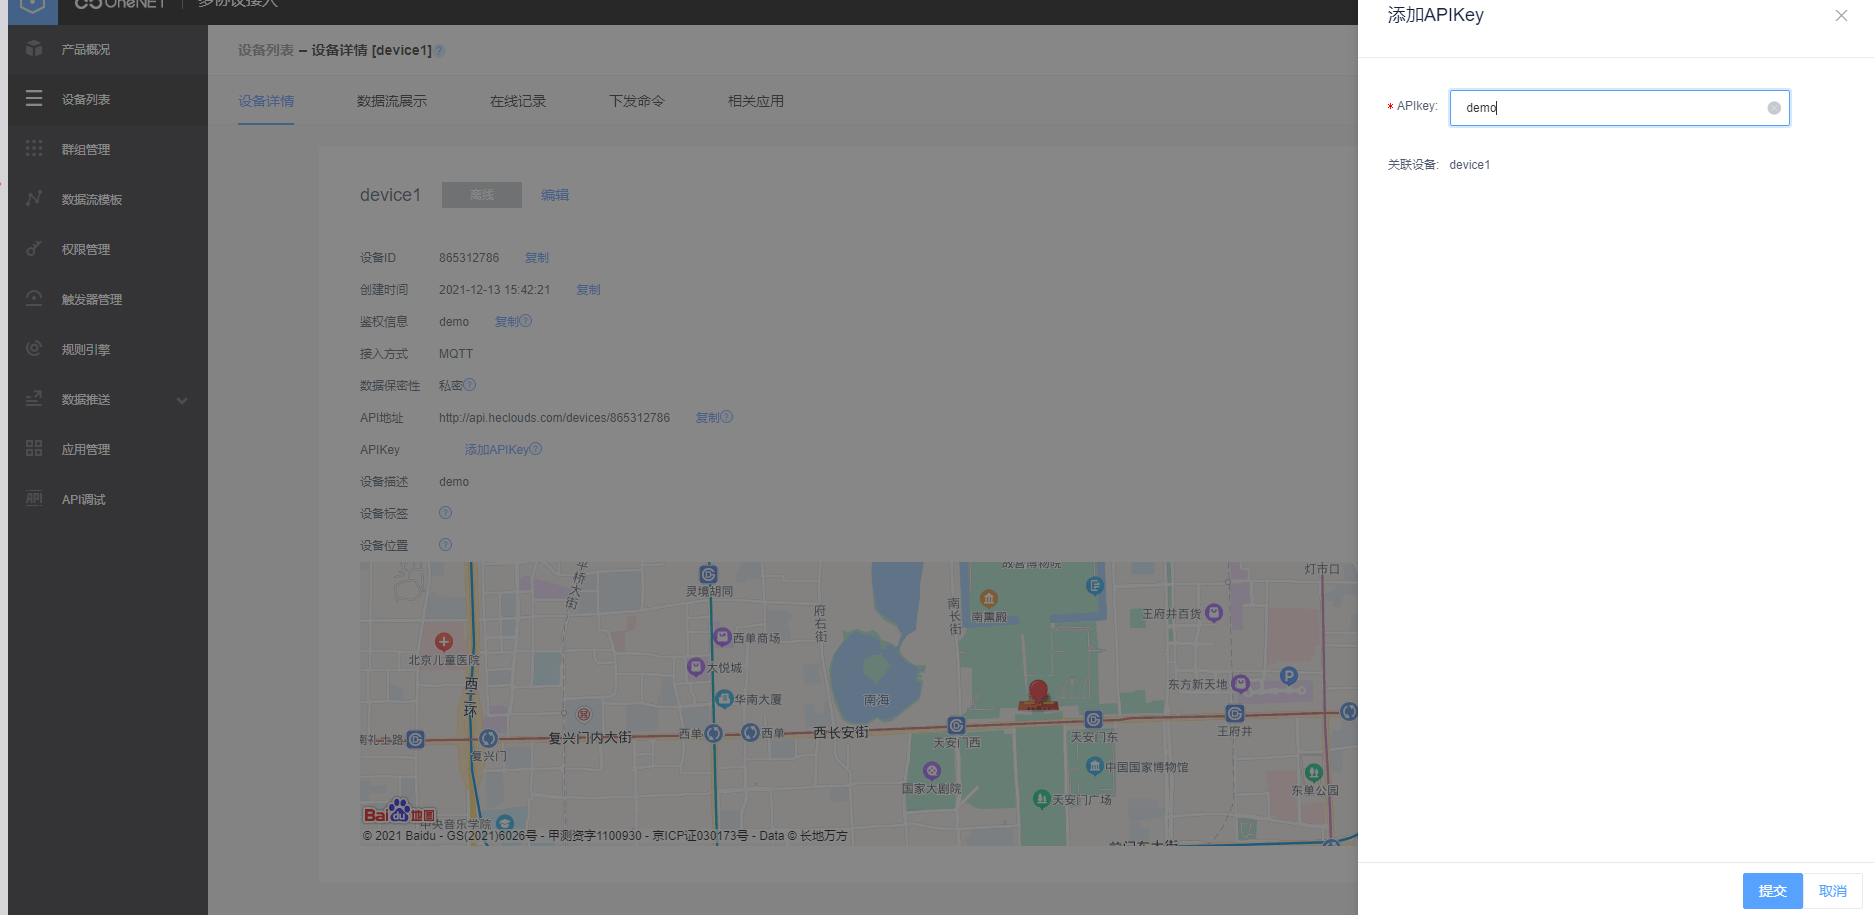
- 激活APIK(键入任意信息都可以激活设备对应的apikey)
- 利用API增加本设备中的数据流
- API详情网址:https://open.iot.10086.cn/doc/multiprotocol/book/develop/mqtt/api/8.%E6%96%B0%E5%A2%9E%E6%95%B0%E6%8D%AE%E6%B5%81.html
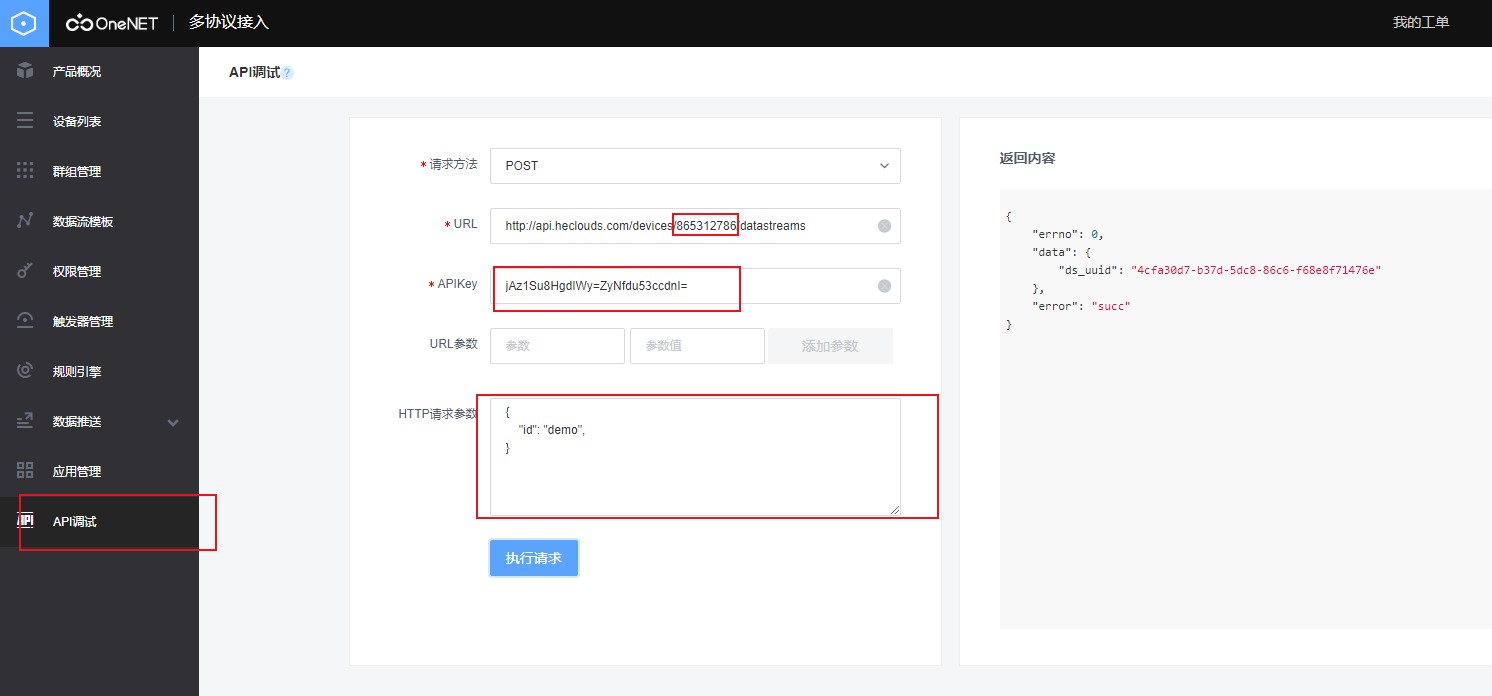
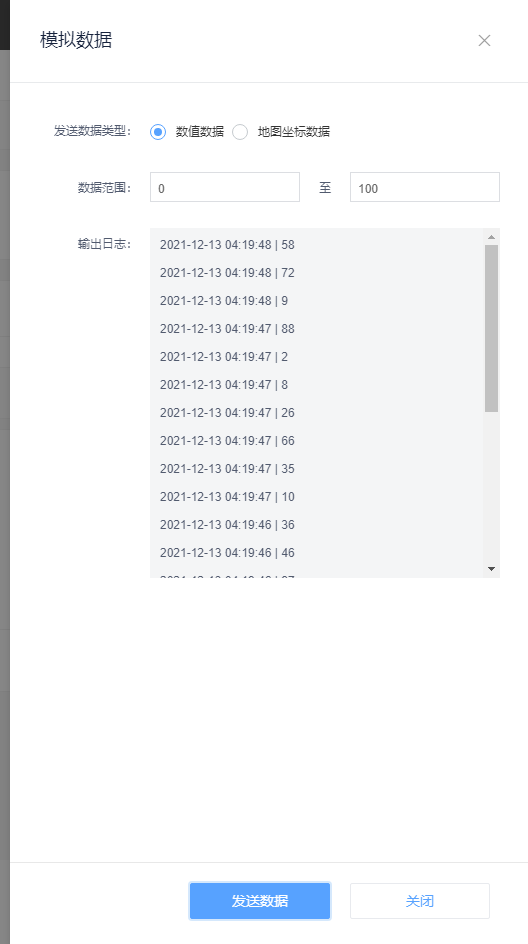
- 在数据流中模拟数据
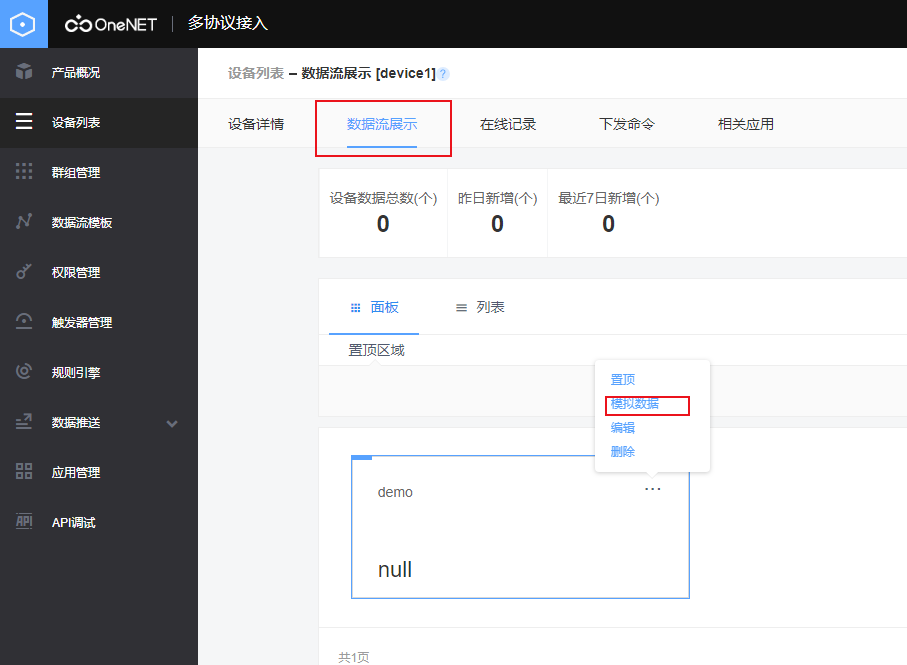
模拟数据点慢一些!模拟数据点慢一些!模拟数据点慢一些!(两三秒间隔最好)
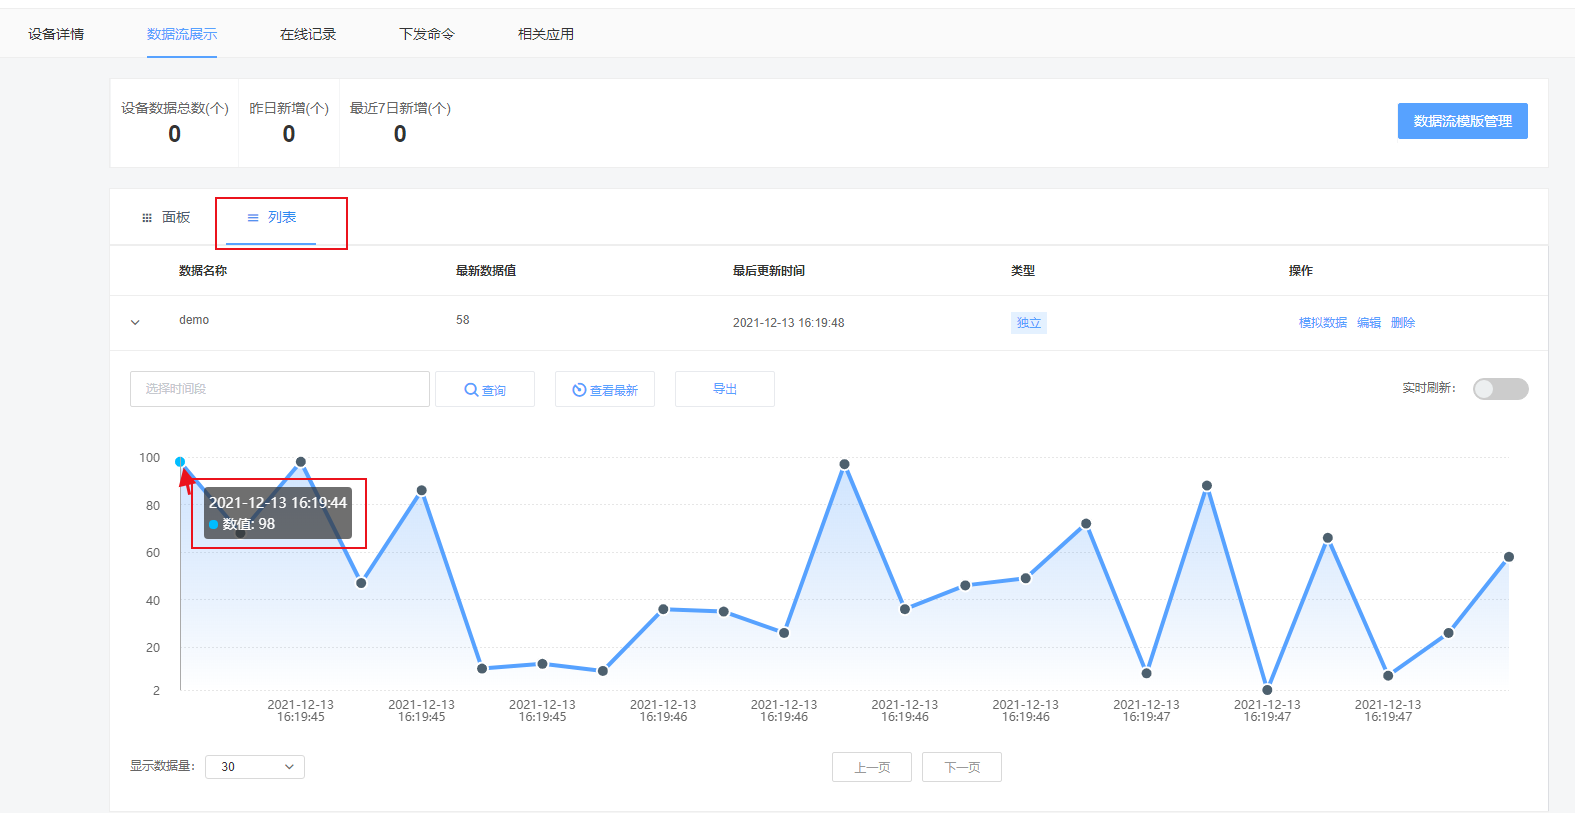
总结信息:
设备ID:865312786
APIKey:jAz1Su8HgdIWy=ZyNfdu53ccdnI=
startId(数据流开始时间) = 2021-12-13T16:19:44
二:Python准备工作
- requests库:requests是python实现的最简单易用的HTTP库,建议爬虫使用requests。
- json:JSON(JavaScript Object Notation) 是一种轻量级的数据交换格式,易于人阅读和编写。
- openpyxl:读写Excel的python库,是一个比较综合的工具,能够同时读取和修改Excel文档。
- pandas:Numpy在向量化的数值计算中优势明显,但是在处理较为复杂的数据,例如标签化的数据中表现力不从心,而基于Numpy库进行开发的Pandas提供了使得数据分析变得更简单的高级数据结构和操作工具。
- matplotlib:Matplotlib主要的作用,是用来生成绘图,直方图,功率谱,条形图,错误图,散点图等,而Matplotlib是一个Python的2D绘图库,它以各种硬拷贝格式和跨平台的交互式环境生成出版质量级别的图形。
- configparser:配置文件 xxx.ini
- os: 路径操作:os.path字库,处理文件路径及信息
进程管理:启动系统中其他程序
环境参数:获得系统软硬件信息等环境参数
此处我在pycharm中下载的库:
1: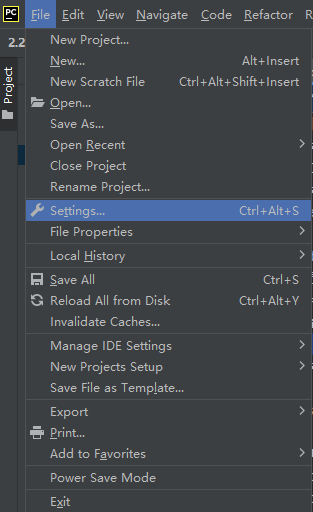
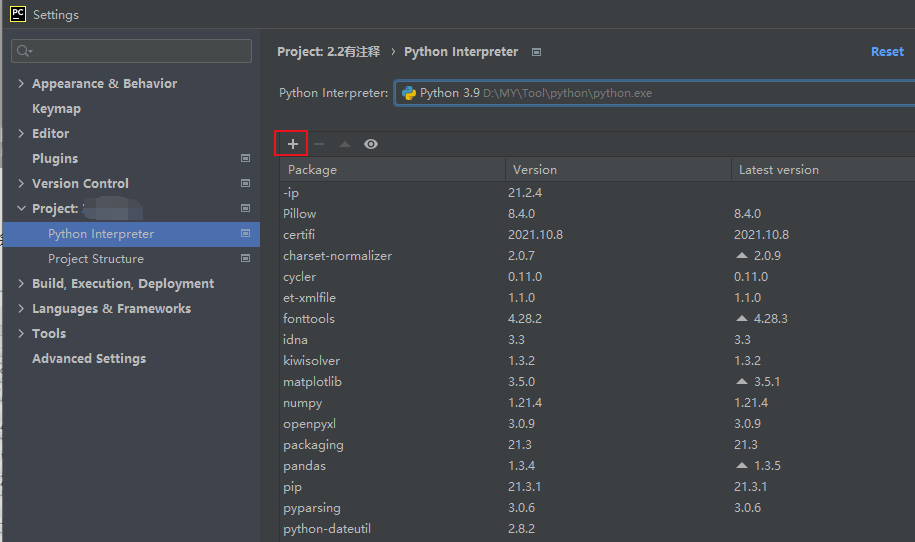
2:不会下载的可以用我写好的txt文件,在终端程序中下载
下载命令:pip install -r xxx.txt
txt内容:
certifi==2021.10.8 charset-normalizer==2.0.7 cycler==0.11.0 et-xmlfile==1.1.0 fonttools==4.28.2 idna==3.3 kiwisolver==1.3.2 matplotlib==3.5.0 numpy==1.21.4 openpyxl==3.0.9 packaging==21.3 pandas==1.3.4 Pillow==8.4.0 pyparsing==3.0.6 python-dateutil==2.8.2 pytz==2021.3 requests==2.26.0 setuptools-scm==6.3.2 six==1.16.0 tomli==1.2.2 urllib3==1.26.7 xlrd==2.0.1

三:代码编写
1:xxx.ini文件:
[config]
; 项目名称
projectId = python实战
; 变量名称
variAble = 温度
;设备ID
deviceId = 865312786
; 设备对应API
APIKey = jAz1Su8HgdIWy=ZyNfdu53ccdnI=
; 数据开始测量时间
startId = 2021-12-13T16:19:44
; 表格名称及路径
excelId = ./temperature.xlsx
; 表格中sheet表名称
sheetId = Sheet9
; 此处根据所需url对应添加 stream为可获取设备详情的url point为可获得设备历史数据的url
streamHttp = http://api.heclouds.com/devices/
pointHttp = http://api.heclouds.com/devices/
2:py文件:
import requests
import json
import openpyxl as op
import pandas as pd
from matplotlib import pyplot as plt
import configparser
import os

# ------------------------------获取配置文件参数------------------------------
def getconfig():
    # 配置文件路径
    curpath = os.path.dirname(os.path.realpath(__file__))
    cfgpath = os.path.join(curpath, "config.ini")
    # 创建对象
    conf = configparser.ConfigParser()
    # 读取ini文件
    conf.read(cfgpath, encoding="utf-8")
    # 获取所有的section
    sections = conf.sections()
    # 将section中config作为数组内容分传递到items
    items = conf.items('config')
    # 所需参数数值获取
    projectId = items[0][1]
    variAble = items[1][1]
    deviceId = items[2][1]
    APIKey = items[3][1]
    startId = items[4][1]
    excelId = items[5][1]
    sheetId = items[6][1]
    streamHttp = items[7][1]
    pointHttp = items[8][1]
    return [projectId, variAble, deviceId, APIKey, startId,excelId,sheetId,streamHttp,pointHttp]
# ------------------------------获取onenet设备数据------------------------------
def setconfig(did,api,startid,streamHttp,pointHttp):
    #pid:项目名称,vae:变量名称,did:设备ID,point:数据信息,tit:设备名称,eid:excel名称及路径,sid:sheet名(形参下同)
    # url配置参数
    payload = {'start':startid,'limit':6000}
    headers = {'api-key': api}
    # 设备详情API
    url_stream = streamHttp+did
    # 从设备详情信息中取出设备号数据(title)
    Title = requests.get(url_stream, headers=headers)
    temp = str(Title.text)
    Jtemp = json.loads(temp)
    data = Jtemp['data']
    keys = data['keys']
    for index, values in enumerate(keys):
        title = values.get('title','')
    # 设备历史数据API
    url_point = pointHttp+did+"/datapoints"
    Point = requests.get(url_point, headers=headers, params=payload)
    # 从设备历史数据中取出数据流中数据信息
    temp = str(Point.text)
    Jtemp = json.loads(temp)
    data = Jtemp['data']
    datastreams = data['datastreams']
    for index, values in enumerate(datastreams):
        point = values.get('datapoints','')
    return  [title, point]
# ------------------------------数据导入excel------------------------------
def writeExcel(pid,vae,did,point,tit,eid,sid):
    # 创建excel表
    ws = op.Workbook()
    # 创建sheet表单
    wb = ws.create_sheet(sid)
    # 表头信息
    wb.cell(row=1, column=1, value='项目名称')
    wb.cell(row=1, column=2, value='设备名称')
    wb.cell(row=1, column=3, value='设备ID')
    wb.cell(row=1, column=4, value='变量名称')
    wb.cell(row=1, column=5, value='最新数据')
    wb.cell(row=1, column=6, value='时间')
    # 计数器,代表行数
    count = 1
    # 循环数据信息,每次循环一个字典,计数+1
    for index, values in enumerate(point):
        count += 1
        # time代表数据信息对应时间'at',temp代表数据信息'value'
        time = str(values.get('at', ''))
        temp = str(values.get('value', ''))
        # 随循环递增exlce表内容,row代表行,column代表列,value代表要添加的信息
        wb.cell(row=count, column=1, value='项目' + pid)
        wb.cell(row=count, column=2, value='设备' + tit)
        wb.cell(row=count, column=3, value=did)
        wb.cell(row=count, column=4, value=vae)
        wb.cell(row=count, column=5, value=temp)
        wb.cell(row=count, column=6, value=time)
        # 保存表格
        ws.save(eid)
    ws.close()
# ------------------------------数据导入折线图------------------------------
def drawPicture(pid,vae,did,point,tit):
    # 解决数据输出时列名不对齐的问题
    pd.set_option('display.unicode.east_asian_width', True)
    # list_x存储时间信息,list_y存储数据信息
    list_x = []
    list_y = []
    plt.ion()
    for index, values in enumerate(point):
        x_time = str(values.get('at', ''))
        y_temperature = float((values.get('value', '')))
        # 每次循环所获数值,添加到对应列表中
        list_x.append(x_time)
        list_y.append(y_temperature)
        # 清楚figure坐标轴
        plt.clf()
        # 防止中文乱码
        plt.rcParams['font.sans-serif'] = ['SimHei']
        # 防止负号不显示
        plt.rcParams['axes.unicode_minus'] = False
        # 传递x和y轴数据,后续参数为格式控制
        plt.plot(list_x, list_y, color="r", marker="o", linestyle="-", alpha=0.5, mfc="c")
        # 设置x和y轴名称
        plt.xlabel("时间")
        plt.ylabel("温度")
        # x轴赋值
        dfdate_x = ['%s 时' % i for i in list_x]
        plt.xticks(list_x, dfdate_x, rotation=320)
        # 设置网格线
        plt.grid(color="g", linestyle=":", alpha=0.5)
        # 设置图例
        plt.legend(("项目:" + pid + ", 设备:" + did + "-" + tit + vae,))
        # 设置标题
        plt.title("温度传感器", fontdict={'fontsize': 15, 'fontweight': 20, 'va': 'center'}, loc="center")
        # 延时
        plt.pause(0.5)
        plt.ioff()
    plt.show()
# ------------------------------窗口输出信息------------------------------
def configprint(pid,vae,did,point,tit):
    #计数循环,窗口递增输出数据流信息
    count = 1
    print('项目名称' + 'ttt' + '设备名称' + 'tttt' + '设备ID' + 'ttttt' + '变量名称'
           + 'ttt' + '最新数据' + 'tttt' + '时间')
    for index, values in enumerate(point):
        count += 1
        time = str(values.get('at', ''))
        temperature = str(values.get('value', ''))
        print(pid + 'tttt' + tit + 'tttt' + did + 'tttt' + vae + 'tttt' + temperature
              + 'tttt' + time)
# ------------------------------main()------------------------------
if __name__ == "__main__":
    # 调用configGet获取配置文件参数
    configGet = getconfig()
    projectId = configGet[0]    # 项目名称
    variAble = configGet[1]     # 变量名称
    deviceId = configGet[2]     # 设备ID
    APIKey = configGet[3]       # API配置参数
    startId = configGet[4]      # 数据流开始时间
    excelId = configGet[5]      # excle名称及路径
    sheetId = configGet[6]      # sheet名称
    streamHttp = configGet[7]   # 对应url使用参数
    pointHttp = configGet[8]    # 对应url使用参数
    # 调用configSet设置参数
    configSet = setconfig(deviceId,APIKey,startId,streamHttp,pointHttp)
    title = configSet[0]        # 设备名称
    point = configSet[1]        # 数据流中数据信息
    for index, values in enumerate(point):
        time = str(values.get('at', ''))
        temperature = float((values.get('value', '')))
        if(time != ""):
            # 数据对应时间不为空,即可执行窗口输出,写入excel,构画折线图
            configprint(projectId,variAble,deviceId,point,title)
            writeExcel(projectId,variAble,deviceId,point,title,excelId,sheetId)
            drawPicture(projectId,variAble,deviceId,point,title)
            break
        else:
            print("error:NO POINT!")
        break
四:效果展示
1:excel表格:
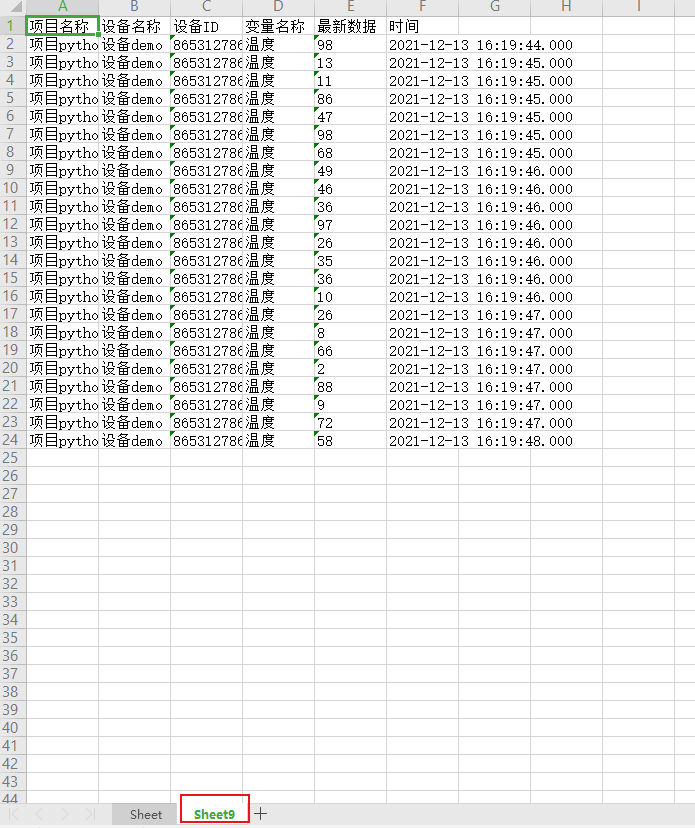
2:窗口输出:
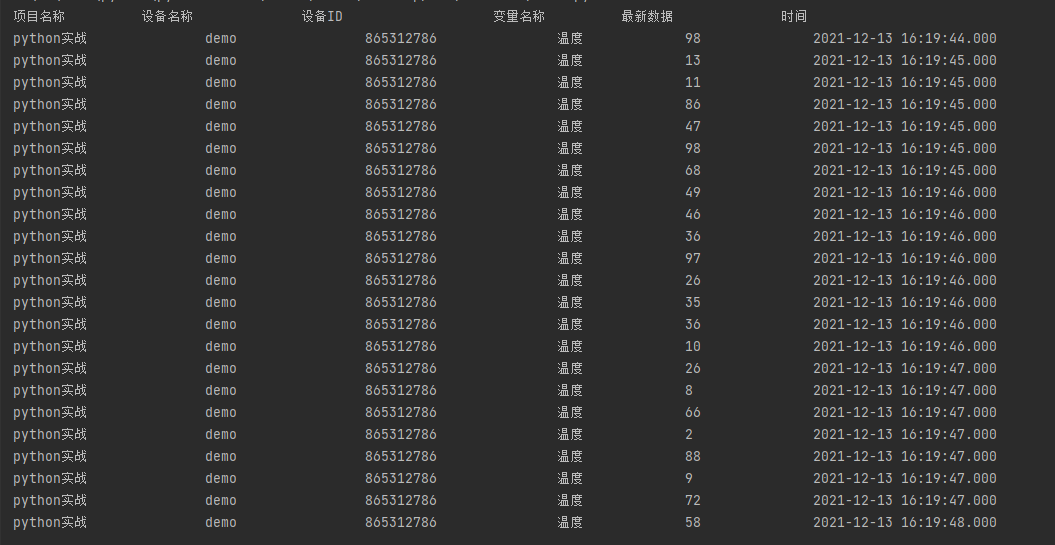
3:动态折线图:
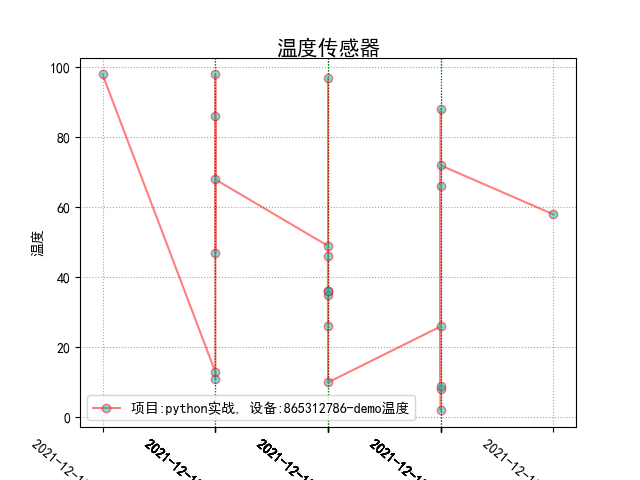
此处为模拟数据时鼠标点击过快,造成同一秒钟出现多个数据,代码运行时可以动态展示折线图无影响。
相关资源:Python实战一源码:
最后
以上就是陶醉招牌最近收集整理的关于Python实战一:抓取onenet数据抓取onenet数据,并通过EXCEL和动态折线图展示的全部内容,更多相关Python实战一:抓取onenet数据抓取onenet数据内容请搜索靠谱客的其他文章。


发表评论 取消回复