目录
1,定义函数
2,循环语句
分别用for和while循环结构编写程序,求出
计时函数:
3,plot画图
1,2-D line plot
2,fplot绘制函数或表达式
1,fplot()
2,fplot(funx,funy)
例题
隐函数绘图
1,定义函数
三种定义方式
//%以定义average函数举例
%1
function y= average(x);//x must be a vector
y=sum(x)/length(x);
>>z=1:99
average(z)
>>ans=50
//2 定义可以output mean and standard deviation的函数
function [m,s]=fun_name(x)
n=length(x);
m=sum(x)/n;
s=sqrt(sum((x-m).^2/n);
//call the function from the command line
>>values=[somenumbers...];
[m,s]=fun_name(values)
//define 2 functions in 1 file(and the file name is fun1.m)
function [m,s]=fun_name(x)
n=length(x);
m=average(x)/n;
s=sqrt(sum((x-m).^2/n));//just use "func. average" in fun. two
end
function y= average(x)
y=sum(x)/length(x);
end
//ATTN average is a local function, only available to other functionswithin the same file
1. (简答题)1. 设x为一个长度为n的数组,编程求下列均值和标准差
并就x=( 81, 70, 65,51, 76, 66, 90, 87, 61, 77)计算。
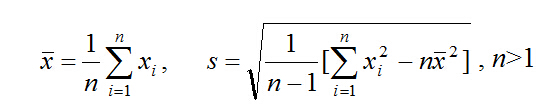
函数段
function [xbar,s]=ex2_1(x)
n=length(x);
xbar=sum(x)/n;
s=sqrt((sum(x.^2)-n*xbar^2)/(n-1));
2,循环语句
两类1,for 2,while
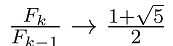
3. 用循环语句形成Fibonacci数列
并验证极限
(提示:计算至两边误差小于精度
)


clear;
F(1)=1;F(2)=1;k=2;x=0; %这里取x=0的目的是保证后面abs(x-a)>e成立
e=1e-8; a=(1+sqrt(5))/2;
while abs(x-a)>e
k=k+1;F(k)=F(k-1)+F(k-2); x=F(k)/F(k-1);
end
a,x,k
分别用for和while循环结构编写程序,求出
并考虑一种避免循环语句的程序设计,比较不同算法的运行时间。
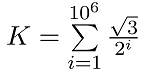
计时函数:
tic;toc
clc;clear;
tic;
s=0;
for i=1:10^6
s=s+(3^(1/2))/2^i;
end
s
toc
Elapsed time is 0.072023 seconds.
tic;
s=0;i=1;
while i<=1000000
s=s+sqrt(3)/2^i;i=i+1;
end
s,
toc
Elapsed time is 0.077023 seconds.
tic;
s=0;
i=1:1000000;
s=sqrt(3)*sum(1./2.^i);
s
toc
Elapsed time is 0.012778 seconds.
结论:非循环语句运行时间远比循环语句快
3,plot画图
1,2-D line plot
Syntax about "plot"
plot(Y)
plot(X1,Y1,...,Xn,Yn)
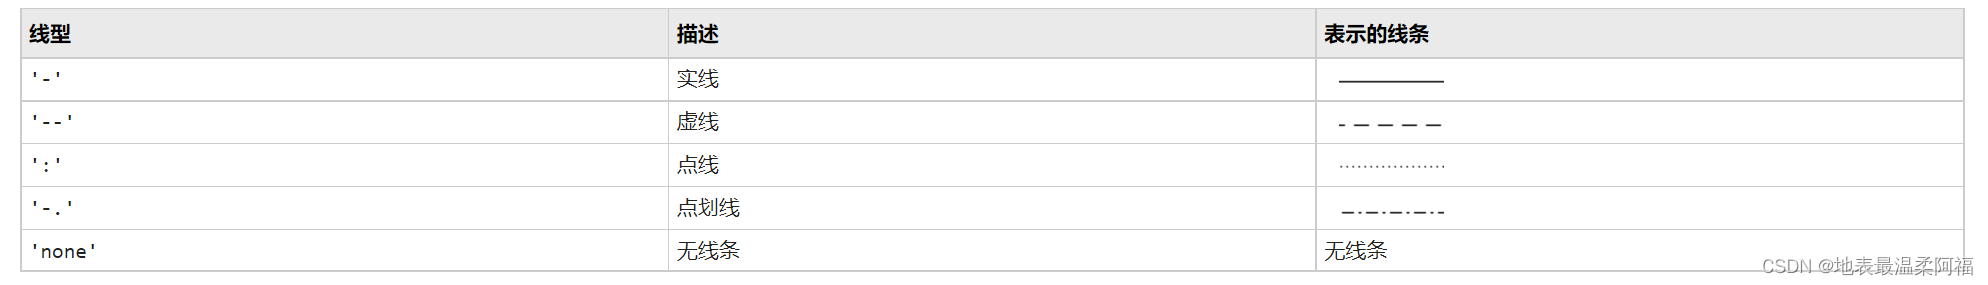
plot(X1,Y1,LineSpec,...,Xn,Yn,LineSpec)
plot(...,'PropertyName',PropertyValue,...)
plot(axes_handle,...) %坐标区
h = plot(...)
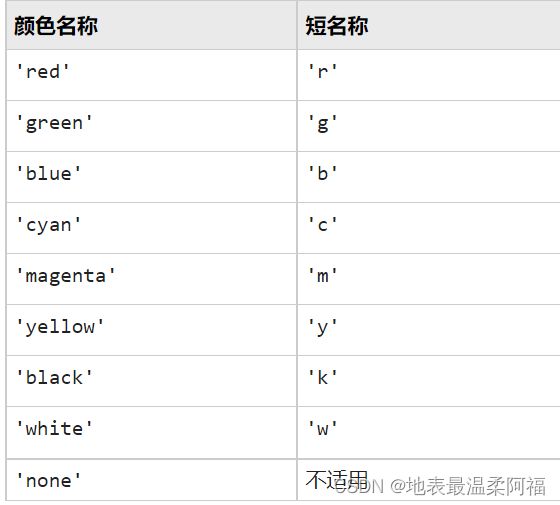
常用PropertyName:color,linetype

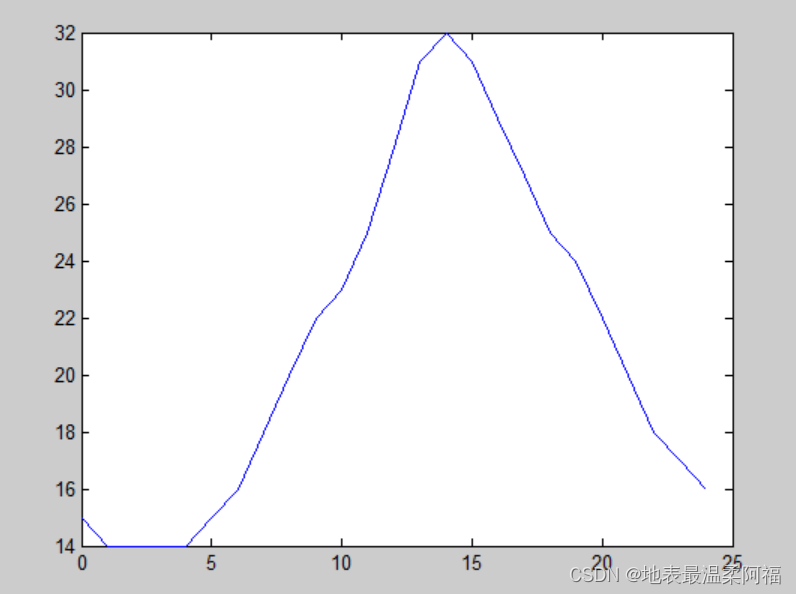
5. 假定某天的气温变化记录如下表,试作图描述这一天的气温变化规律。
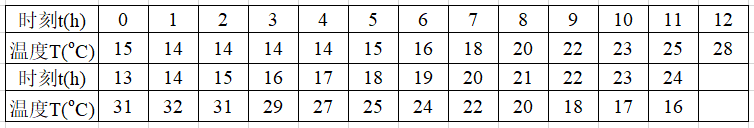
clear
time=0:1:24;
tem=[15,14,14,14,14,15,16,18,20,22,23,25,28,31,32,31,29,27,25,24,22,20,18,17,16];
plot(time,tem)
2,fplot绘制函数或表达式
1,fplot()
e.g
>>fplot(@(x) sin(x))
默认interval[-5 5]
2,fplot(funx,funy)
fplot(ax,funx,funy,tinterval,LineSpec,Name,Value)
fp = fplot(___)
[x,y] = fplot(___)
例题
6. 作出下列函数图象
(1) 曲线
(要求分别使用plot或fplot完成)
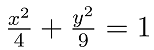
(2) 椭圆

%(1)
x=-2:0.1:2;
y=x.^2.*sin(x.^2-x-2);
plot(x,y)
y=inline('x^2*sin(x^2-x-2)');
% or y=(x.^2).*sin(x.^2-x-2);
fplot(y,[-2 2])
%2
t=linspace(0,2*pi,100); %注意步长取法,不要简单用t=0:0.1:2*pi,否则造成椭圆缺口
x=2*cos(t);y=3*sin(t); plot(x,y)
%2
ezplot('(x.^2)./4+(y.^2)./9 = 1')
隐函数绘图
2013a像fimplicit这种函数就没办法用
Cuz that function was introduced in release R2016b (so sad)
所以我们只能用ezplot或者手动转化成参数方程
最后
以上就是时尚发卡最近收集整理的关于DHU MATLAB experiment note<2> 1,定义函数2,循环语句 3,plot画图的全部内容,更多相关DHU内容请搜索靠谱客的其他文章。


发表评论 取消回复