目前关于TCP在实际网络中的吞吐量情况,基本可以说缺乏数据支撑。而关于网络研究的论文,则是层出不穷。Nearly all of them are done with some fucking ridiculous assumptions and draw conclusion which only work under such assumptions.
关于dash传输优化的研究已经很多了。最近的论文一般是基于增强学习的优化方法。使用机器学习的方法,就需要有数据集。powerinfo公司收集了TCP的吞吐量数据,与ACM multimedia 2019合作举办了一个比赛[1]。竞赛中使用的数据有人工干预的成分。他们给了我一些最初收集的数据[2](提取码: gs4g ),主要是在wifi和4G网络中收集的,大致是999份。
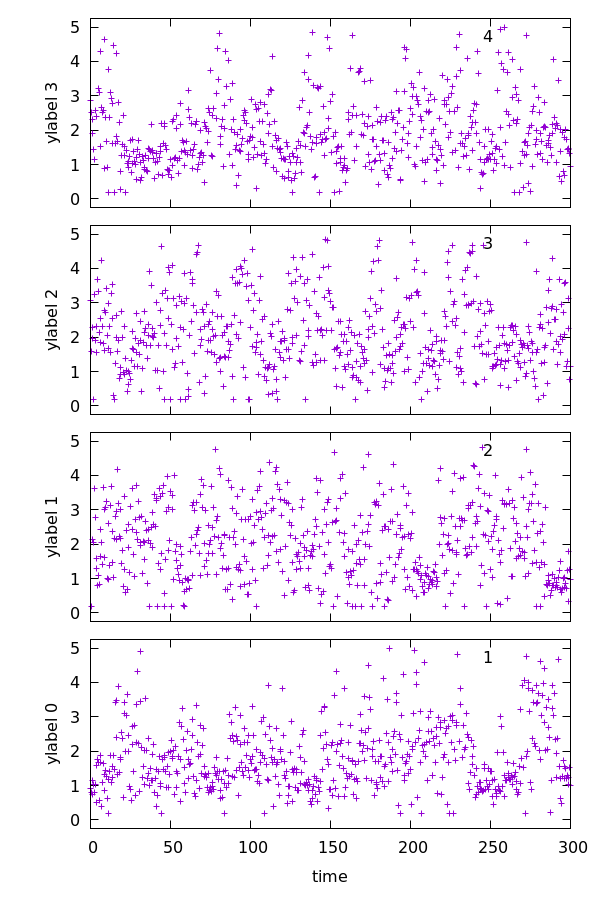
我把其中的一些数据画出来。画图脚本:
rate_plot.sh
#! /bin/sh
file1=$1
file2=$2
file3=$3
file4=$4
fileout=$5
gnuplot<<!
set terminal pngcairo size 600, 900
set output "${fileout}.png"

set lmargin at screen 0.15
set rmargin at screen 0.95

TOP=0.98
DY = 0.21
seam=0.02

set multiplot
set offset 0,0,graph 0.05, graph 0.05
set xrange [0:300]
set yrange [0:5]
set xlabel 'time'
set ylabel 'ylabel 0' offset 1
set tmargin at screen TOP-3*DY-3*seam
set bmargin at screen TOP-4*DY-3*seam
plot "${file1}" u 1:2 title '1'

set xtics format ''
unset xlabel
set ylabel 'ylabel 1' offset 1
set tmargin at screen TOP-2*DY-2*seam
set bmargin at screen TOP-3*DY-2*seam
plot "${file2}" u 1:2 title '2'


set ylabel 'ylabel 2' offset 1
set tmargin at screen TOP-DY-1*seam
set bmargin at screen TOP-2*DY-1*seam
plot "${file3}" u 1:2 title '3'

set ylabel 'ylabel 3' offset 1
set tmargin at screen TOP
set bmargin at screen TOP-DY
plot "${file4}" u 1:2 title '4'

unset multiplot;
set output
exit
!
plot_trace.py
import os
def file_name_walk(file_dir):
    filenames=[]
    for root, dirs, files in os.walk(file_dir):
        files.sort()
        for i in range(len(files)):
            filenames.append(root+"/"+files[i])
    return filenames
picname="pic_%s"
command="./rate_plot.sh %s %s %s %s %s"
filenames=file_name_walk("trace")
aligh_in_4=len(filenames)/4
offset=0
for i in range(aligh_in_4):
    out=picname%str(i)
    file1=filenames[offset]
    file2=filenames[offset+1]
    file3=filenames[offset+2]
    file4=filenames[offset+3]
    offset=offset+4
    script=command%(file1,file2,file3,file4,out)
    status = os.system(script)
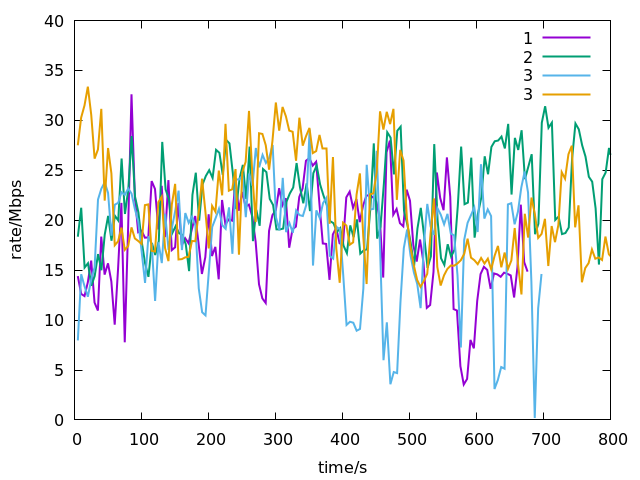
例子(横轴时间/秒,竖轴速率/Mbps):
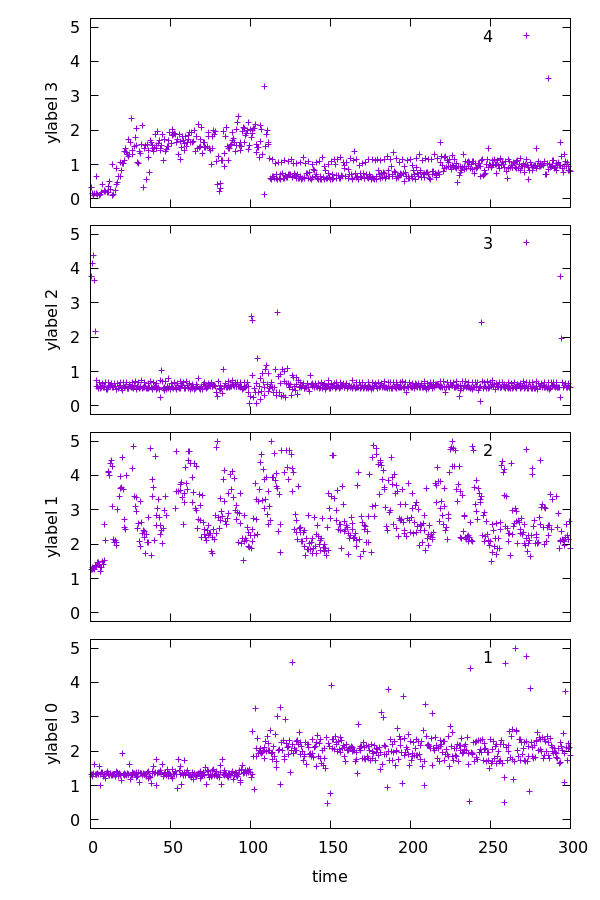
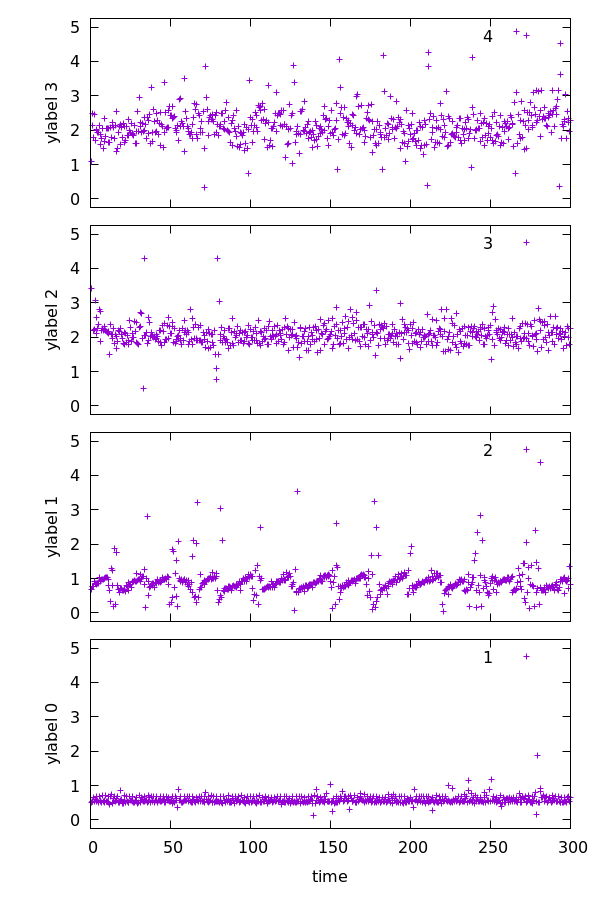
上面图示的是极少的情况,TCP的吞吐量还是很平稳的,大部分图像都很直。
根据[1]中数据画图。
文献[6]给出了4g速率的分布饼图。
数据集[9,10],获取速率就需要一定的转换,它的trace文件中的数字代码的是一个MTU大小的数据包离开链路的时刻。
Each line gives a timestamp in milliseconds (from the beginning of the trace) and represents an opportunity for one 1500-byte packet to be drained from the bottleneck queue and cross the link. If more than one MTU-sized packet can be transmitted in a particular millisecond, the same timestamp is repeated on multiple lines.
根据以上描述,写出计算速率的脚本,mahimahi_rate.py
#!/usr/bin/python
delimiter="_"

class Client:
    def __init__(self,prefix,id,interval):
       self.id=id
       name=prefix+delimiter+str(id)+".txt"
       self.fout=open(name,'w')
       self.samples=0;
       self.left_ts_in_interval=0;
       self.right_ts_in_interval=0;
       self.bytes_in_interval=0
       self.last_sample_ts=0;
       self.interval=interval;
       self.bytesTatal=0;
    def __del__(self):
        self.fout.close()
    def OnNewSample(self,id,ts,len):
        if id!=self.id:
            return
        if self.samples==0:
            self.left_ts_in_interval=ts
            self.last_sample_ts=ts
            self.right_ts_in_interval=ts
        sec=float(ts)/1000
        if ts>self.last_sample_ts:
            if ts-self.left_ts_in_interval>self.interval:
                rate=0.0;
                if self.right_ts_in_interval>self.left_ts_in_interval:
                    delta_bytes=self.bytes_in_interval*8*1.0;
                    delta_duration=1000.0*(self.right_ts_in_interval-self.left_ts_in_interval)
                    rate=delta_bytes/delta_duration
                self.left_ts_in_interval=ts
                self.bytes_in_interval=0
                self.fout.write(str(sec)+"t"+str(rate)+"n")
        self.last_sample_ts=ts
        self.right_ts_in_interval=ts
        self.samples=self.samples+1
        self.bytesTatal+=len
        self.bytes_in_interval+=len

prefix="4g_upload"
log_in=["uplink-4g-no-cross-subway.pps","uplink-4g-no-cross-times","uplink-4g-with-cross-subway.pps","uplink-4g-with-cross-times"]
id=0
interval=5000 #1s
clients={}
for i in range(len(log_in)):
    client=Client(prefix,id,interval)
    clients[id]=client
    with open(log_in[i]) as txtData:
        count=0
        for line in txtData.readlines():
            lineArr = line.strip().split()
            time=int(lineArr[0])
            count+=1
            clients.get(id).OnNewSample(id,time,1500)
    id+=1
clients.clear()
以[10]中文件为例,求出4G链路的上传带宽(log_in=[“ATT-LTE-driving.up”,“ATT-LTE-driving-2016.up”,“Verizon-LTE-driving.up”,“Verizon-LTE-short.up”])
以[10]中文件为例,求出4G链路的上传带宽(log_in=[“uplink-4g-no-cross-subway.pps”,“uplink-4g-no-cross-times”,“uplink-4g-with-cross-subway.pps”,“uplink-4g-with-cross-times”])。
[10]中trace的4G上传带宽还是很大的。[9]trace的4G上传带宽较小。这种数据差异就和测试方式有关了,如果放置的服务器同基站距离很近,获得的带宽基本就是4G的接入带宽大小。
论文[11]提供了rtp媒体流的数据集。
[12]给出了不同国家LTE网络的吞吐量。According to the report, the U.S. had an average cellular network throughout of 1.97 Mbps, better than India and Hong Kong (both 1.94 Mbps) and Brazil (1.14 Mbps), but weaker than Germany (2.04 Mbps), Russia (2.10 Mbps), South Korea (2.11 Mbps), France (3.05 Mbps) and Singapore (3.55 Mbps).
[13] 中收集的是视频会议中的传输带宽。
数据抽取脚本 pro-bw.py
import os
def line_reader(fileName,process):
    for index, line in enumerate(open(fileName,'r')):
        process.ProcessLine(line)
class Processor(object):
    def __init__(self):
        self.file_name="bandwidth-"
        self.index=1
        self.lines_in_file=0;
        self.last_time=0
        self.f_out=open(self.file_name+str(self.index)+".txt",'w')
    def __del__(self):
        self.f_out.close()
    def ProcessLine(self,line):
        lineArr= line.strip().split()
        if(len(lineArr)>0):
            if(lineArr[0].startswith('ID') and self.lines_in_file>0):
                self.f_out.close()
                self.lines_in_file=0
                self.last_time=0
                self.index=self.index+1
                self.f_out=open(self.file_name+str(self.index)+".txt",'w')
        if(len(lineArr)==4):
            now=int(lineArr[0])
            delta=0
            if(self.last_time==0):
                self.last_time=now
            delta=now-self.last_time
            self.f_out.write(str(delta)+"t"+lineArr[1]+"t"+
            lineArr[2]+"t"+lineArr[3]+"n")
            self.lines_in_file=self.lines_in_file+1
process=Processor()
fileName="publishResult_2019-05-12.txt"
line_reader(fileName,process)
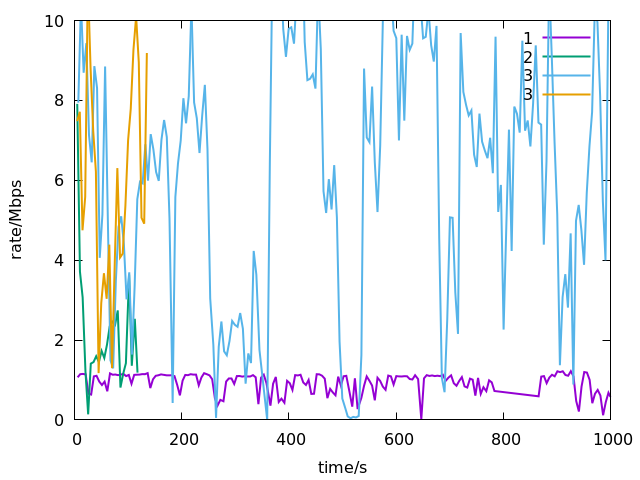
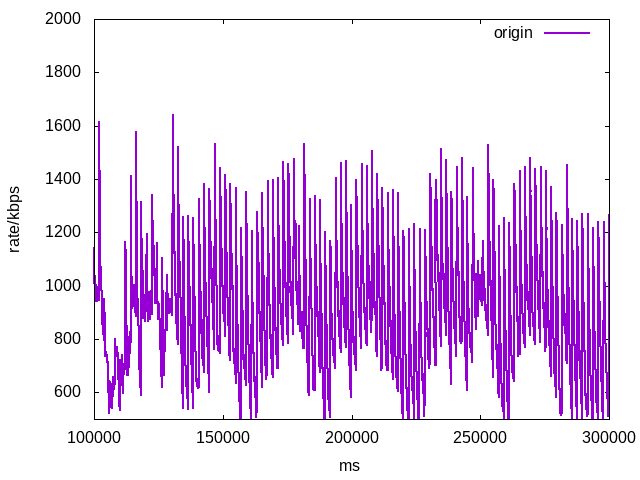
根据上述脚本,其中有一个名字为bandwidth-14.txt数据文件。画出带宽变化情况。
[1] LiveStreamingDemo
[2] dingdian datase
[3] Beyond Throughput: a 4G LTE Dataset with Channel and Context Metrics
[4] 4G trace dataset
[5] Online Learning for Robust Adaptive Video Streaming in Mobile Networks
[6] Improving Onboard Internet Services for High-Speed Vehicles by Multipath Transmission in Heterogeneous Wireless Networks
[7] Adaptive Video Pacing Method Based on the Prediction of Stochastic TCP Throughput
[8] Cross-Layer Scheduler for Video Streaming over MPTCP
[9] mahimahi-traces
[10] Cellular-Traces-2018
[11] Measurements of Real-Time Traffic to Residential Users
[12] https://www.fiercewireless.com/wireless/kwicr-study-u-s-lte-speeds-middle-pack
[13] MultiLive_dataset
最后
以上就是粗暴鸡翅最近收集整理的关于tcp throughput trace dataset的全部内容,更多相关tcp内容请搜索靠谱客的其他文章。


发表评论 取消回复