✅作者简介:热爱科研的Matlab仿真开发者,修心和技术同步精进,matlab项目合作可私信。
????个人主页:Matlab科研工作室
????个人信条:格物致知。
更多Matlab仿真内容点击????
智能优化算法 神经网络预测 雷达通信 无线传感器
信号处理 图像处理 路径规划 元胞自动机 无人机 电力系统
⛄ 内容介绍
箱形图(英文:Box plot),又称为盒须图、盒式图、盒状图或箱线图,是一种用作显示一组数据分散情况资料的统计图。因型状如箱子而得名。在各种领域也经常被使用,常见于品质管理,快速识别异常值。
箱形图最大的优点就是不受异常值的影响,能够准确稳定地描绘出数据的离散分布情况,同时也利于数据的清洗。
⛄ 完整代码
%DABOXPLOT_DEMO a few examples of DABOXPLOT functionality%%%%%%%%%%%%%%%%%%%%%%%%%%%%%%%%%%%%%%%%%%%%%%%%%%%%%%%%%%%%%%%%%%%%%%%%%%%rng('default')% data in a cell arraydata1{1} = randn([60,4]); % Humansdata1{2} = randn([60,4]); % Dogsdata1{3} = randn([60,4]); % Goddata1{4} = randn([60,4]); % Potato% data in a numreic array (+ grouping indices)data2 = [randn([30,4]); randn([30,4]);...randn([30,4]); randn([30,4])];group_inx = [ones(1,30), 2.*ones(1,30), 3.*ones(1,30), 4.*ones(1,30)];% skewed data in a numeric array (+ group indices)data3 = [pearsrnd(0,1,-1,5,25,1); pearsrnd(0,1,-2,7,25,1); ...pearsrnd(0,1,1,8,25,1)];group_inx2 = [ones(1,25), 2.*ones(1,25), 3.*ones(1,25)];% data with group differences in a cell arraydata4{1} = randn([60,3]) + (0:0.5:1); % Humansdata4{2} = randn([60,3]) + (2:2:6); % Dogsgroup_names = {'Humans', 'Dogs' , 'God', 'Potato'};condition_names = {'Water', 'Land', 'Moon', 'Hyperspace'};% an alternative color scheme for some plotsc = [0.45, 0.80, 0.69;...0.98, 0.40, 0.35;...0.55, 0.60, 0.79;...0.90, 0.70, 0.30];figure('Name', 'daboxplot_demo','WindowStyle','docked');% default boxplots for one group and three conditionssubplot(3,3,1)h = daboxplot(data2(:,1:3),'groups',group_inx(1:30));% non-filled boxplots and cutomized medianssubplot(3,3,2)h = daboxplot(data2(:,1:3),'groups',group_inx(1:60),'outsymbol','kx',...'xtlabels', condition_names,'fill',0,'legend',group_names(1:2));ylabel('Performance');xl = xlim; xlim([xl(1), xl(2)+1]); % make more space for the legendset(h.md,'Color','k','LineWidth',1.5); % customize median lines% filled boxplots, different color scheme, non-jittered scatter underneathsubplot(3,3,3)h = daboxplot(data2(:,1:3),'groups',group_inx(1:90),'outsymbol','k+',...'xtlabels', condition_names,'legend',group_names(1:3),'color',c,...'whiskers',0,'scatter',2,'jitter',0,'scattersize',13);ylabel('Performance');xl = xlim; xlim([xl(1), xl(2)+1]); % make more space for the legend% transparent boxplots with no whiskers and jittered datapoints underneathsubplot(3,2,3)h = daboxplot(data1,'scatter',2,'whiskers',0,'boxalpha',0.7,...'xtlabels', condition_names);ylabel('Performance');xl = xlim; xlim([xl(1), xl(2)+0.75]); % make space for the legendlegend([h.bx(1,:)],group_names); % add the legend manuallyset(gca,'FontSize',9);% different color scheme, a color flip, different outlier symbolsubplot(3,2,4)h = daboxplot(data2,'groups',group_inx,'xtlabels', condition_names,...'colors',c,'fill',0,'whiskers',0,'scatter',2,'outsymbol','k*',...'outliers',1,'scattersize',16,'flipcolors',1,'boxspacing',1.2,...'legend',group_names);ylabel('Performance');xl = xlim; xlim([xl(1), xl(2)+0.75]); % make more space for the legendset(gca,'FontSize',9);% different color scheme, data scattered on topsubplot(3,2,5:6)h = daboxplot(data2,'groups',group_inx,...'xtlabels', condition_names,'colors',c,'whiskers',0,...'scatter',1,'scattersize',15,'scatteralpha',0.5,...'boxspacing',0.8,'legend',group_names);ylabel('Performance');set(gca,'FontSize',9.5);xl = xlim; xlim([xl(1), xl(2)+0.2]); % make more space for the legend%--------------------------------------------------------------------------figure('Name', 'daboxplot_demo2','WindowStyle','docked');% three groups, one condition, indicating means with dotted linessubplot(2,2,1)h = daboxplot(data3,'groups',group_inx2,'mean',1,'color',c,...'xtlabels',group_names);ylabel('Performance');% using linkline to emphasize interaction effects (group*condition)subplot(2,2,2)h = daboxplot(data4,'linkline',1,...'xtlabels', condition_names,'legend',group_names(1:3),...'whiskers',0,'outliers',1,'outsymbol','r*','scatter',2,'boxalpha',0.6);ylabel('Performance'); ylim([-2.5 8.8]);xl = xlim; xlim([xl(1), xl(2)]); % make more space for the legend% TIP: to make the plots vertical use camroll(-90)
function h = daboxplot(Y,varargin)%DABOXPLOT draws neat boxplots for multiple groups and multiple conditions%% Description:%% Creates boxplots organized by condition and colored by group. Supports% various options such as scatter, transparency, outliers, mean and% group linking lines, scaling, etc, to maximize data readability. See% daboxplot_demo. for examples of the use and functionality.%% Syntax:%% daboxplot(Y)% daboxplot(Y,param,val,...)% h = daboxplot(Y)% h = daboxplot(Y,param,val,...)%% Input Arguments:%% Y - data input (matrix or cell array) containing all conditions and all% groups. If Y is a matrix, each column has to correspond to different% condition, while the groups need to be specified in 'groups' vector.% If Y is a cell array, each cell has to contain data matrices for each% group (columns being different conditions). In such case, the grouping% is done automatically based on the cell structure.%% Optional Input Parameter Name/Value Pairs:%% NAME VALUE%% 'groups' A vector containing grouping variables. By default% assumes a single group for a matrix data input.%% 'fill' 0 - non-filled boxplots (contrours only)% 1 - boxplots filled with color (default)%% 'colors' The RGB matrix for box colors of different groups% (each row corresponding to a different group). If% boxplots are filled, these are the fill colors with% the edges being black. If boxplots are not filled,% these colors are used for edges. These colors can be% also used for scatter data instead (see 'flipcolors')% Default colors: default matlab colors%% 'whiskers' Draws whiskers to show min and max data values after% disregarding the outliers (see outlier description)% 0 - no whiskers% 1 - draw whiskers (default)%% 'scatter' 0 - no datta scatter (deffault)% 1 - on top of the boxplot% 2 - underneath the boxplot%% 'scattersize' Size of the scatter markers. Default: 15%% 'scattercolors' Colors for the scattered data: {face, edge}% Default: {'k','w'}%% 'flipcolors' Will flip the colors of scatter points and boxplots% 0 - boxplots colored by group (default)% 1 - scatter is colored by group%% 'scatteralpha' Transparency of scattered data (between 0 and 1)% Default: 1 (completely non-transparent)%% 'jitter' 0 - do not jitter scattered data% 1 - jitter scattered data (default)%% 'mean' 0 - do not mark the mean (default)% 1 - mark the mean with a dotted line%% 'outliers' Highlights the outliers in the plot. The outliers% are values below Q1-1.5*IQR and above Q3+1.5*IQR.% 0 - do not highlight outliers% 1 - highlight outliers (default)%% 'outsymbol' Symbol and color for highlighting outliers.% Default: 'rx' (red crosses).%% 'boxalpha' Boxplot transparency (between 0 and 1)% Default: 1 (completely non-transparent)%% 'boxspacing' A real number to scale spacing between boxes in the% same condition. Note that negative values result in% partially overlapping boxes within the same condition% Default: 1%% 'boxwidth' A real number to scale the width of all boxes. Note% that this also controls the spacing between different% conditions (while spacings in the same condition are% controlled by 'boxspacing')% Default: 1%% 'linkline' Superimposes lines linking boxplots across conditions% for each group. Helps to see more clearly possible% interaction effects between conditions and groups.% 0 - no dash lines (default)% 1 - dash lines%% 'xtlabels' Xtick labels (a cell of chars) for conditions. If% there is only 1 condition and multiple groups, then% xticks and xtlabels will automatically mark different% groups.% Default: conditions/groups are numbered in the input% order%% 'legend' Names of groups (a cell) for creating a legend% Default: no legend%% 'outlierfactor' Multiple of the interquartile range used to find% outliers. Outliers are values below% Q1-outlierfactor*IQR and above Q3+outlierfactor*IQR% Default: 1.5%% Output Arguments:%% h - a structure containing handles for further customization of% the produced plot:% cpos - condition positions% gpos - group positions%% graphics objects:% bx - boxplot box% md - median line% mn - mean line% sc - scattered data markers% ot - outlier markers% wh - whiskers% ln - line linking boxplots% lg - legend%%% For examples have a look at daboxplot_demo.m%%% Povilas Karvelis <karvelis.povilas@gmail.com>% 15/04/2019%%%%%%%%%%%%%%%%%%%%%%%%%%%%%%%%%%%%%%%%%%%%%%%%%%%%%%%%%%%%%%%%%%%%%%%%%%%%%%h = struct;p = inputParser;% specify default optionsaddOptional(p, 'groups', []);addOptional(p, 'fill', 1);addOptional(p, 'colors', get(gca,'colororder'));addOptional(p, 'whiskers', 1);addOptional(p, 'scatter', 0);addOptional(p, 'scattersize', 15)addOptional(p, 'scattercolors', {'k','w'});addOptional(p, 'flipcolors', 0);addOptional(p, 'scatteralpha', 1);addOptional(p, 'jitter', 1);addOptional(p, 'mean', 0);addOptional(p, 'outliers', 1);addOptional(p, 'outsymbol', 'rx');addOptional(p, 'boxalpha', 1);addOptional(p, 'boxspacing', 1);addOptional(p, 'boxwidth', 1);addOptional(p, 'linkline',0);addOptional(p, 'xtlabels', []);addOptional(p, 'legend', []);addOptional(p, 'outlierfactor', 1.5);% parse the input optionsparse(p, varargin{:});confs = p.Results;% get group indices and labelsif ~isempty(confs.groups)[Gi,Gn,Gv] = grp2idx(confs.groups);num_groups = numel(Gv);end% find the number of groupsif iscell(Y)num_groups = numel(Y);y = []; Gi = [];for g = 1:num_groupsy = [y; Y{g}];Gi = [Gi; g*ones(size(Y{g},1),1)];end% default numbered group labelsif ~exist('Gn','var')for g = 1:num_groupsGn{g} = num2str(g);endendY = y; % replace the cell with a data arrayelseif ismatrix(Y)% assume 1 group if none are specifiedif isempty(confs.groups)Gi = ones(size(Y,1),1);num_groups = 1;endend% find condition positionsif any(size(Y)==1)Y = Y(:);cpos = 1;elsecpos = 1:size(Y,2);endnum_locs = numel(cpos);% use condition positions to scale spacingsgpos=[];if num_locs==1gpos = (1:num_groups)';box_width = 1/3*confs.boxwidth;cpos=gpos;elseif num_groups==1gpos = cpos;box_width = 1/3*confs.boxwidth;elsebox_width = (2/3)/(num_groups+1)*confs.boxwidth; % calculate box widthloc_sp = (box_width/3)*confs.boxspacing; % local spacing between boxplots% set group positions for each groupfor g = 1:num_groupsgpos = [gpos; cpos + (g-(num_groups+1)/2)*(box_width + loc_sp)];endendendh.gpos = gpos;h.cpos = cpos;% loop over groupsfor g = 1:num_groups% get percentilespt = prctile(Y(Gi==g,:),[2 9 25 50 75 91 98]);means = mean(Y(Gi==g,:));if size(pt,1)==1 pt=pt'; end % a fix for plotting one conditionIQR = (pt(5,:)-pt(3,:));% create coordinates for drawing boxesy25 = reshape([pt(3,:); pt(3,:)], 1, []);y75 = reshape([pt(5,:); pt(5,:)], 1, []);x1 = [gpos(g,:) - box_width/2; gpos(g,:) - box_width/2];x2 = [gpos(g,:) + box_width/2; gpos(g,:) + box_width/2];box_ycor = [y75; y25];box_xcor = reshape([x1; x2],2,[]);box_mdcor = reshape([pt(4,:); pt(4,:)], 1, []);box_mncor = reshape([means; means], 1, []);% create coordinates for drawing whiskers with cross-hatches and endshat_xcor = [gpos(g,:) - box_width/4; gpos(g,:) + box_width/4];whi_xcor = [gpos(g,:); gpos(g,:)];% draw one box at a timefor k = 1:num_locsdata_vals = Y(Gi==g,k); % data for a single box% determine outliers and whisker lengthol = data_vals<(pt(3,k)-confs.outlierfactor*IQR(k)); % indices of lower outliersou = data_vals>(pt(5,k)+confs.outlierfactor*IQR(k)); % indices of upper outlierswhi_ycor(:,1,k) = [min(data_vals(~ol)), pt(3,k)]; % lower whiskerwhi_ycor(:,2,k) = [max(data_vals(~ou)), pt(5,k)]; % upper whisker% jitter or notif confs.jitter==1xdata = gpos(g,k).*ones(numel(Y(Gi==g,k)),1) + ...(box_width/3).*(0.5 - rand(numel(Y(Gi==g,k)),1));elseif confs.jitter==0xdata = gpos(g,k).*ones(numel(Y(Gi==g,k)),1);end% index values for each boxwk = (1:2)+2*(k-1);Xx = box_xcor(1:2,wk);Yy = box_ycor(1:2,wk);% filled or not filled boxesif confs.fill==0% no fill boxh.bx(k,g) = line([Xx(:,1)' Xx(1,:) Xx(:,2)' Xx(2,:)],...[Yy(:,1)' Yy(1,:) Yy(:,2)' Yy(2,:)],...'color',confs.colors(g,:),'LineWidth',1.5);hold on;% draw the medianh.md(k,g) = line(Xx(1,:), box_mdcor(wk),...'color',confs.colors(g,:), 'LineWidth', 2);% draw the meanif confs.mean==1h.mn(k,g) = line(Xx(1,:),box_mncor(wk),'LineStyle',':',...'color',confs.colors(g,:),'LineWidth', 1.5);endelseif confs.fill==1% box filled with colorh.bx(k,g) = fill([Xx(:,1)' Xx(1,:) Xx(:,2)' Xx(2,[2,1])],...[Yy(:,1)' Yy(1,:) Yy(:,2)' Yy(2,:)],confs.colors(g,:));set(h.bx(k,g),'FaceAlpha',confs.boxalpha);hold on;% draw the medianh.md(k,g) = line(Xx(1,:), box_mdcor(wk),...'color','k', 'LineWidth', 2);% draw the meanif confs.mean==1h.mn(k,g) = line(Xx(1,:),box_mncor(wk),'LineStyle',':',...'color','k','LineWidth', 1.5);endendox = data_vals>max(data_vals); % default - no outliers% draw outliersif confs.outliers==1ox = data_vals<whi_ycor(1,1,k) | data_vals>whi_ycor(1,2,k);h.ot(k,g) = scatter(xdata(ox),data_vals(ox),confs.scattersize,...confs.outsymbol);endif confs.whiskers==1% draw whiskersh.wh(k,g,:) = plot(whi_xcor(:,k),whi_ycor(:,1,k),'k-',...hat_xcor(:,k),[whi_ycor(1,1,k) whi_ycor(1,1,k)],'k-',...whi_xcor(:,k),whi_ycor(:,2,k),'k-',...hat_xcor(:,k),[whi_ycor(1,2,k) whi_ycor(1,2,k)],'k-',...'LineWidth',1);end% scatter on top of the boxplotsif confs.scatter==1 || confs.scatter==2h.sc(k,g) = scatter(xdata(~ox),data_vals(~ox),...confs.scattersize,...'MarkerFaceColor', confs.scattercolors{1},...'MarkerEdgeColor', confs.scattercolors{2},...'MarkerFaceAlpha', confs.scatteralpha);hold on;endend% put scattered data underneath boxplotsif confs.scatter==2uistack(h.sc(:,g),'bottom')endif confs.linkline==1h.ln(g) = line(gpos(g,:),pt(4,:),'color',confs.colors(g,:),...'LineStyle','-.','LineWidth',1.5);endend% move lines to the backgroundif confs.linkline==1uistack(h.ln,'bottom')end% flip scatter and box colors and make a legendif confs.flipcolors==1box_class = class(h.bx); % box filled or noif strcmp(box_class,'matlab.graphics.primitive.Patch')set(h.bx,'FaceColor',confs.scattercolors{1});set(h.md,'Color',confs.scattercolors{2});if confs.mean==1set(h.mn,'Color',confs.scattercolors{2});endelseset(h.bx,'Color',confs.scattercolors{1});set(h.md,'Color',confs.scattercolors{1});if confs.mean==1set(h.mn,'Color',confs.scattercolors{1});endendfor g = 1:num_groupsset(h.sc(:,g),'MarkerFaceColor',confs.colors(g,:))end% add a legend based on scatter colorsif ~isempty(confs.legend)h.lg = legend(h.sc(1,:),confs.legend);endelse% add a legend based on box colorsif ~isempty(confs.legend)h.lg = legend(h.bx(1,:),confs.legend);endend% set ticks and labelsset(gca,'XTick',cpos,'XTickLabels',cpos,'box','off');if ~isempty(confs.xtlabels)set(gca,'XTickLabels',confs.xtlabels,'XTick',cpos);endxlim([gpos(1)-3*box_width, gpos(end)+3*box_width]); % adjust x-axis marginsend
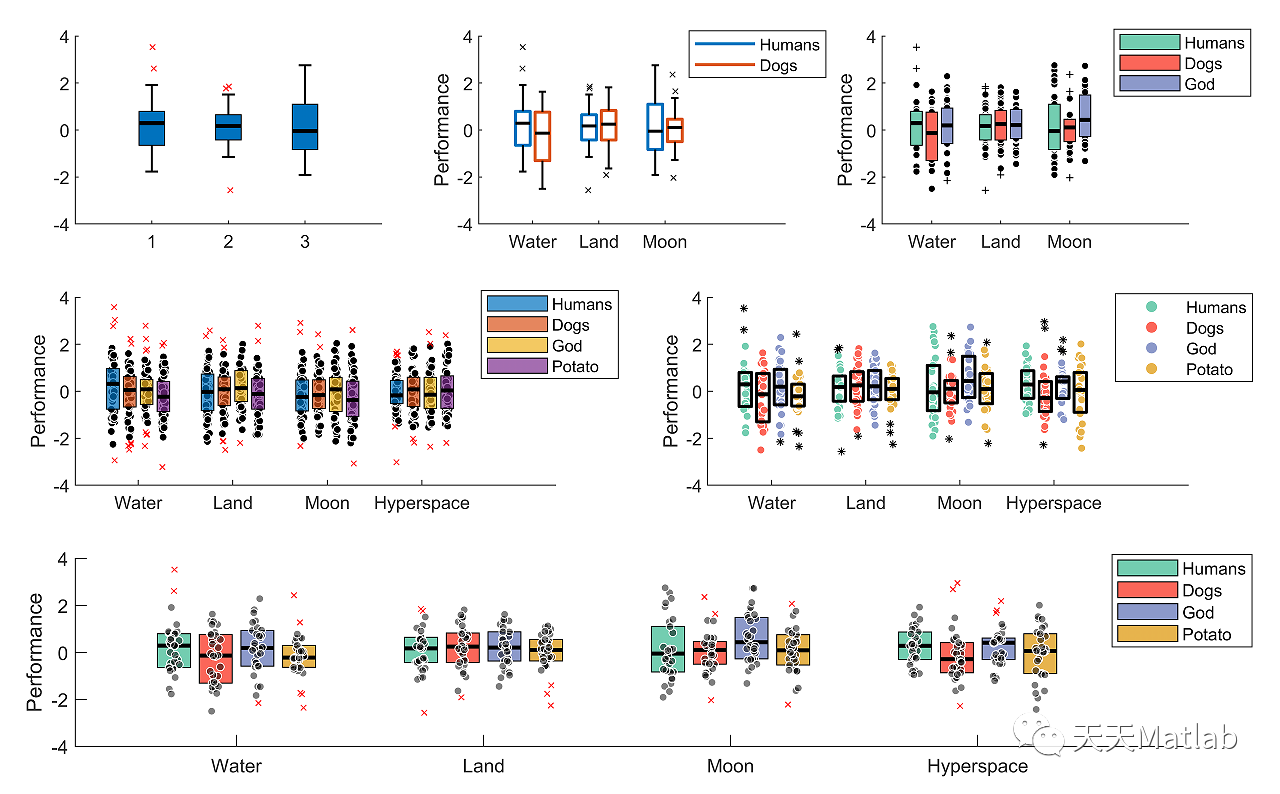
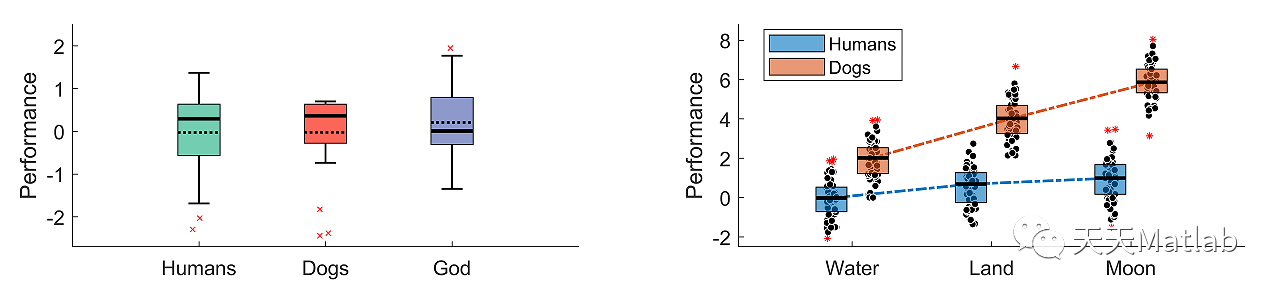
⛄ 运行结果
⛄ 参考文献
❤️ 关注我领取海量matlab电子书和数学建模资料
❤️部分理论引用网络文献,若有侵权联系博主删除
最后
以上就是留胡子皮带最近收集整理的关于matlab实现花式箱体图的全部内容,更多相关matlab实现花式箱体图内容请搜索靠谱客的其他文章。
本图文内容来源于网友提供,作为学习参考使用,或来自网络收集整理,版权属于原作者所有。


发表评论 取消回复