本文实例实现一个如下图所示的Android折线图,供大家参考,具体内容如下
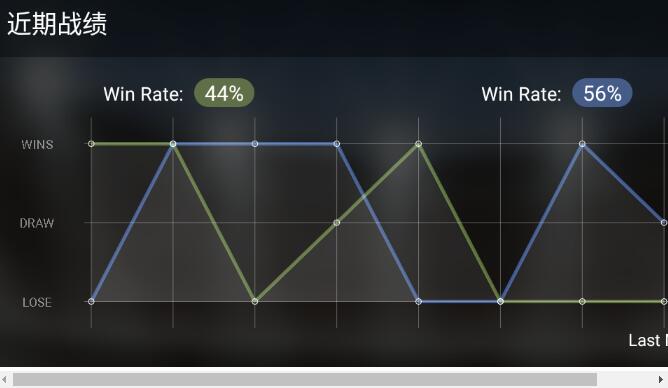

首先是控件绘图区域的划分,控件左边取一小部分(控件总宽度的八分之一)绘制表头,右边剩余的部分绘制表格
确定表格的行列数,首先绘制一个三行八列的网格,设置好行列的坐标后开始绘制
/*绘制三条横线*/
for(int i=0;i<3;i++){
  canvas.drawLine(textWide, mLineYs[i], totalWidth, mLineYs[i], mPaintLine);
}
/*绘制八条竖线*/
for(int i=0;i<8;i++){
  canvas.drawLine(mLineXs[i], 0, mLineXs[i], totalHeight, mPaintLine);
}
网格绘制完成后,开始绘制折线图
根据输入的节点数据,分别绘制两条折线
通过canvas的drawLine方法依次连接两点即可
在每个数据节点处绘制一个小圆,突出显示
/*绘制第一条折线的路径*/
for (int i = 0; i < mPerformance_1.length - 1; i++) {
  /*折线图的折线的画笔设置粗一点*/
  mPaintLine.setStrokeWidth(5);
  /*计算当前节点的坐标值*/
  float prePointX =mLineXs[i];
  float prePointY =mLineYs[2] - (mLineYs[2] - mLineYs[mPerformance_1[i].type]) * animCurrentValue;
  /*计算下一个节点的坐标值*/
  float nextPointX=mLineXs[i + 1];
  float nextPointY=mLineYs[2] - (mLineYs[2] - mLineYs[mPerformance_1[i + 1].type]) * animCurrentValue;
  /*连接当前坐标和下一个坐标,绘制线段*/
  canvas.drawLine(prePointX, prePointY, nextPointX, nextPointY, mPaintLine1);
  /*当前节点坐标处绘制小圆*/
  canvas.drawCircle(prePointX, prePointY, mSmallDotRadius, mPointPaint);
}
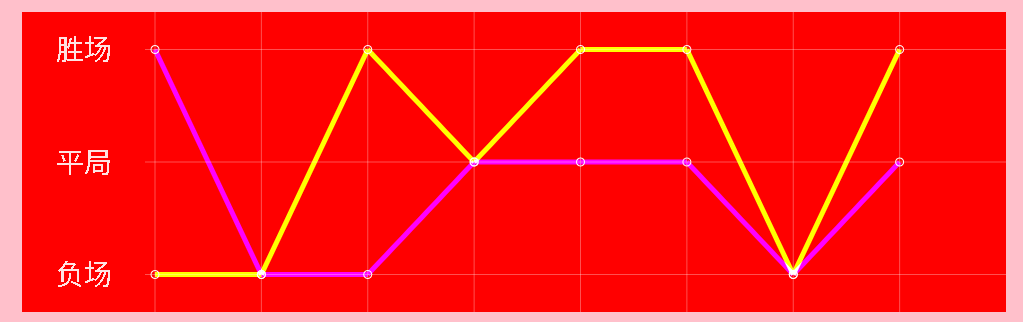
两条折线重合的地方,需要特殊考虑,比如希望两条折线重合的地方折线变为白色
设置下两条折线的画笔即可
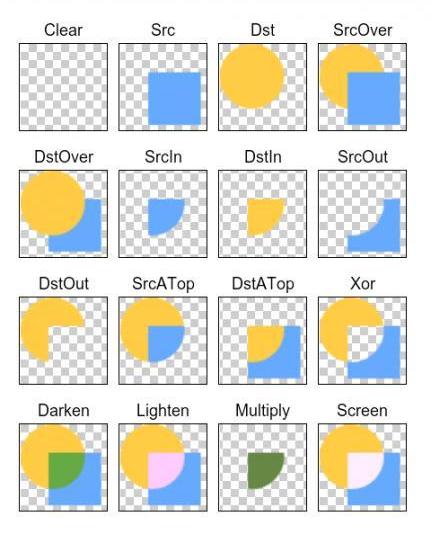
mPaintLine2.setXfermode(new PorterDuffXfermode(PorterDuff.Mode.SCREEN));
mPaintLine1.setXfermode(new PorterDuffXfermode(PorterDuff.Mode.SCREEN));
测试代码及效果;
final Random random=new Random();
final LineChartView myView=(LineChartView)findViewById(R.id.custom_view);
final LineChartView.Performance[] performances1=new LineChartView.Performance[8];
final LineChartView.Performance[] performances2=new LineChartView.Performance[8];
myView.setOnClickListener(new View.OnClickListener(){
  @Override
  public void onClick(View v){
    for(int i=0;i<performances1.length;i++){
      switch (random.nextInt(2016)%3){
        case 0:
          performances1[i]= LineChartView.Performance.WIN;
          break;
        case 1:
          performances1[i]= LineChartView.Performance.DRAW;
          break;
        case 2:
          performances1[i]= LineChartView.Performance.LOSE;
          break;
        default:
          performances1[i]= LineChartView.Performance.LOSE;
          break;
      }
      switch (random.nextInt(2016)%3){
        case 0:
          performances2[i]= LineChartView.Performance.WIN;
          break;
        case 1:
          performances2[i]= LineChartView.Performance.DRAW;
          break;
        case 2:
          performances2[i]= LineChartView.Performance.LOSE;
          break;
        default:
          performances1[i]= LineChartView.Performance.LOSE;
          break;
      }
    }
    myView.setPerformances(performances1,performances2);
  }
});
完整代码如下:
public class LineChartView extends View {
  private Context context;
  /*动画插值器*/
  DecelerateInterpolator mDecelerateInterpolator = new DecelerateInterpolator();
  /*动画刷新的次数*/
  private int mDuration = 10;
  /*当前动画进度值*/
  private int mCurrentTime = 0;
  private Performance[] mPerformance_1, mPerformance_2;
  /*两条折线的颜色*/
  private int mLineColor1, mLineColor2;
  /*绘制表头文字画笔*/
  private Paint mPaintText = new Paint();
  /*绘制表格的画笔*/
  private Paint mPaintLine = new Paint();
  /*第一条折线的画笔*/
  private Paint mPaintLine1 =new Paint();
  /*第二条折线的画笔*/
  private Paint mPaintLine2 =new Paint();
  /*坐标点的小圆点画笔*/
  private Paint mPointPaint = new Paint();
  private float mSmallDotRadius = 4;
  private TypedValue typedValue;
  private int mPaintClolor;
  /*Handler刷新界面产生动画效果*/
  private Handler mHandler = new Handler();
  private Runnable mAnimation = new Runnable() {
    @Override
    public void run() {
      if (mCurrentTime < mDuration) {
        mCurrentTime++;
        LineChartView.this.invalidate();
      }
    }
  };

  public LineChartView(Context context) {
    super(context);
    this.context=context;
    init();
  }

  public LineChartView(Context context, AttributeSet attrs) {
    super(context, attrs);
    this.context=context;
    init();
  }

  public LineChartView(Context context, AttributeSet attrs, int defStyleAttr) {
    super(context, attrs, defStyleAttr);
    this.context=context;
    init();
  }

  public enum Performance {
    WIN(0),
    DRAW(1),
    LOSE(2);
    public int type;
    Performance(int type) {
      this.type = type;
    }
  }

  public void setPerformances(Performance[] performance1, Performance[] performance2) {
    if (performance1 == null) {
      performance1 = new Performance[0];
    }
    if (performance2 == null) {
      performance2 = new Performance[0];
    }
    mPerformance_1 = Arrays.copyOf(performance1, performance1.length > 8 ? 8 : performance1.length);
    mPerformance_2 = Arrays.copyOf(performance2, performance2.length > 8 ? 8 : performance2.length);
    if (isShown()) {
      mCurrentTime = 0;
      this.invalidate();
    }
  }

  /**
   * 设置折线1的颜色
   *
   * @param mLineColor1
   */
  public void setLineColor1(int mLineColor1) {
    this.mLineColor1 = mLineColor1;
  }

  /**
   * 设置折线2的颜色
   *
   * @param mLineColor2
   */
  public void setLineColor2(int mLineColor2) {
    this.mLineColor2 = mLineColor2;
  }

  private void init() {
    mLineColor1=Color.BLUE;
    mLineColor2 = Color.GREEN;
    typedValue=new TypedValue();
    context.getTheme().resolveAttribute(R.attr.title_bar,typedValue,true);
    mPaintClolor =getResources().getColor(typedValue.resourceId);

    final LineChartView.Performance[] performances1=new LineChartView.Performance[8];
    final LineChartView.Performance[] performances2=new LineChartView.Performance[8];
    final Random random=new Random();
    for(int i=0;i<performances1.length;i++){
      switch (random.nextInt(2016)%3){
        case 0:
          performances1[i]= LineChartView.Performance.WIN;
          break;
        case 1:
          performances1[i]= LineChartView.Performance.DRAW;
          break;
        case 2:
          performances1[i]= LineChartView.Performance.LOSE;
          break;
        default:
          performances1[i]= LineChartView.Performance.LOSE;
          break;
      }
      switch (random.nextInt(2016)%3){
        case 0:
          performances2[i]= LineChartView.Performance.WIN;
          break;
        case 1:
          performances2[i]= LineChartView.Performance.DRAW;
          break;
        case 2:
          performances2[i]= LineChartView.Performance.LOSE;
          break;
        default:
          performances1[i]= LineChartView.Performance.LOSE;
          break;
      }
    }
    setPerformances(performances1,performances2);
  }


  /**
   * @param canvas
   */
  @Override
  protected void onDraw(Canvas canvas) {
    super.onDraw(canvas);
    /*获取控件总宽高*/
    float totalWidth = getWidth();
    float totalHeight = getHeight();
    /*左边取总宽度的八分之一绘制表格头部*/
    float textWide = totalWidth / 8;
    /*左边留一点空白*/
    float left_offset = 10;
    /*折线图的总宽度等于控件的总宽度减去表头和留白*/
    float chartWide = totalWidth - textWide - left_offset;
    /*一共三行,设置每一行的垂直坐标*/
    float[] mLineYs = new float[]{totalHeight / 8, totalHeight / 2, totalHeight * 7 / 8};
    /*一共八列,设置每一列的水平坐标*/
    float[] mLineXs = new float[]{
        textWide + left_offset + chartWide * 0 / 8,
        textWide + left_offset + chartWide * 1 / 8,
        textWide + left_offset + chartWide * 2 / 8,
        textWide + left_offset + chartWide * 3 / 8,
        textWide + left_offset + chartWide * 4 / 8,
        textWide + left_offset + chartWide * 5 / 8,
        textWide + left_offset + chartWide * 6 / 8,
        textWide + left_offset + chartWide * 7 / 8,
    };

    /*绘制表头文字*/
    mPaintText.setStyle(Paint.Style.FILL);
    mPaintText.setColor(mPaintClolor);
    mPaintText.setAlpha(226);
    mPaintText.setTextSize(28);
    /*从中间开始绘制*/
    mPaintText.setTextAlign(Paint.Align.CENTER);
    /*测量文字大小,并计算偏移量*/
    Paint.FontMetrics fontMetrics = mPaintText.getFontMetrics();
    float textBaseLineOffset = (fontMetrics.bottom - fontMetrics.top) / 2 - fontMetrics.bottom;
    canvas.drawText("胜场", textWide / 2, mLineYs[0] + textBaseLineOffset, mPaintText);
    canvas.drawText("平局", textWide / 2, mLineYs[1] + textBaseLineOffset, mPaintText);
    canvas.drawText("负场", textWide / 2, mLineYs[2] + textBaseLineOffset, mPaintText);

    /*绘制表格画笔设置*/
    mPaintLine.setStyle(Paint.Style.STROKE);
    mPaintLine.setAntiAlias(true);
    mPaintLine.setColor(mPaintClolor);
    mPaintLine.setAlpha(80);
    mPaintLine.setStrokeWidth(1);
    /*开始绘制表格*/
    /*绘制三条横线*/
    for(int i=0;i<3;i++){
      canvas.drawLine(textWide, mLineYs[i], totalWidth, mLineYs[i], mPaintLine);
    }
    /*绘制八条竖线*/
    for(int i=0;i<8;i++){
      canvas.drawLine(mLineXs[i], 0, mLineXs[i], totalHeight, mPaintLine);
    }
    /*折线图画笔设置*/
    mPaintLine1.setStyle(Paint.Style.STROKE);
    /*设置透明度,取值范围为0~255,数值越小越透明,0表示完全透明*/
    mPaintLine1.setAlpha(0);
    mPaintLine1.setAntiAlias(true);
    mPaintLine1.setColor(mLineColor1);
    mPaintLine1.setStrokeWidth(5);
    mPaintLine2.setStyle(Paint.Style.STROKE);
    /*设置透明度,取值范围为0~255,数值越小越透明,0表示完全透明*/
    mPaintLine2.setAlpha(0);
    mPaintLine2.setAntiAlias(true);
    mPaintLine2.setColor(mLineColor2);
    mPaintLine2.setStrokeWidth(5);
    if (typedValue.resourceId==R.color.white){
      /*PorterDuff.Mode.SCREEN 上下层都显示。*/
      mPaintLine2.setXfermode(new PorterDuffXfermode(PorterDuff.Mode.SCREEN));
      mPaintLine1.setXfermode(new PorterDuffXfermode(PorterDuff.Mode.SCREEN));
    }else {
      /*PorterDuff.Mode.DARKEN 上下层都显示。变暗*/
      mPaintLine2.setXfermode(new PorterDuffXfermode(PorterDuff.Mode.DARKEN));
      mPaintLine1.setXfermode(new PorterDuffXfermode(PorterDuff.Mode.DARKEN));
    }
    /*画节点处的小圆点的画笔设置*/
    mPointPaint.setStyle(Paint.Style.STROKE);
    mPointPaint.setAntiAlias(true);
    mPointPaint.setColor(mPaintClolor);


    /*计算当前动画进度对应的数值*/
    float animCurrentValue = mDecelerateInterpolator.getInterpolation(1.0f * mCurrentTime / mDuration);
    mPaintLine.setColor(mLineColor1);
    /*绘制第一条折线的路径*/
    for (int i = 0; i < mPerformance_1.length - 1; i++) {
      /*折线图的折线的画笔设置粗一点*/
      mPaintLine.setStrokeWidth(5);
      /*计算当前节点的坐标值*/
      float prePointX =mLineXs[i];
      float prePointY =mLineYs[2] - (mLineYs[2] - mLineYs[mPerformance_1[i].type]) * animCurrentValue;
      /*计算下一个节点的坐标值*/
      float nextPointX=mLineXs[i + 1];
      float nextPointY=mLineYs[2] - (mLineYs[2] - mLineYs[mPerformance_1[i + 1].type]) * animCurrentValue;
      /*连接当前坐标和下一个坐标,绘制线段*/
      canvas.drawLine(prePointX, prePointY, nextPointX, nextPointY, mPaintLine1);
      /*当前节点坐标处绘制小圆*/
      canvas.drawCircle(prePointX, prePointY, mSmallDotRadius, mPointPaint);
    }
    /*第一个折线图的最后一个节点的坐标*/
    float lastPointX=mLineXs[mPerformance_1.length - 1];
    float lastPointY= mLineYs[2] - (mLineYs[2] - mLineYs[mPerformance_1[mPerformance_1.length - 1].type]) * animCurrentValue;
    /*绘制最后一个节点的外围小圆*/
    canvas.drawCircle(lastPointX,lastPointY ,mSmallDotRadius, mPointPaint);

    /*绘制第二条折线*/
    mPaintLine.setColor(mLineColor2);
    for (int i = 0; i < mPerformance_2.length - 1; i++) {
      /*折线图的折线的画笔设置粗一点*/
      mPaintLine.setStrokeWidth(5);
      /*计算当前节点的坐标值*/
      float prePointX =mLineXs[i];
      float prePointY =mLineYs[2] - (mLineYs[2] - mLineYs[mPerformance_2[i].type]) * animCurrentValue;
      /*计算下一个节点的坐标值*/
      float nextPointX=mLineXs[i + 1];
      float nextPointY=mLineYs[2] - (mLineYs[2] - mLineYs[mPerformance_2[i + 1].type]) * animCurrentValue;
      /*连接当前坐标和下一个坐标,绘制线段*/
      canvas.drawLine(prePointX, prePointY, nextPointX, nextPointY, mPaintLine2);
      /*当前节点坐标处绘制小圆*/
      canvas.drawCircle(prePointX, prePointY, mSmallDotRadius, mPointPaint);
    }
     /*第一个折线图的最后一个节点的坐标*/
    lastPointX=mLineXs[mPerformance_2.length - 1];
    lastPointY= mLineYs[2] - (mLineYs[2] - mLineYs[mPerformance_2[mPerformance_2.length - 1].type]) * animCurrentValue;
    /*绘制最后一个节点的外围小圆*/
    canvas.drawCircle(lastPointX,lastPointY ,mSmallDotRadius, mPointPaint);
    mHandler.postDelayed(mAnimation, 20);
  }
}
以上就是本文的全部内容,希望对大家的学习有所帮助,也希望大家多多支持靠谱客。
最后
以上就是负责大白最近收集整理的关于Android自定义控件实现折线图的全部内容,更多相关Android自定义控件实现折线图内容请搜索靠谱客的其他文章。
本图文内容来源于网友提供,作为学习参考使用,或来自网络收集整理,版权属于原作者所有。


发表评论 取消回复