echarts统计,简单示例
推荐:《PHP视频教程》
先看下效果图
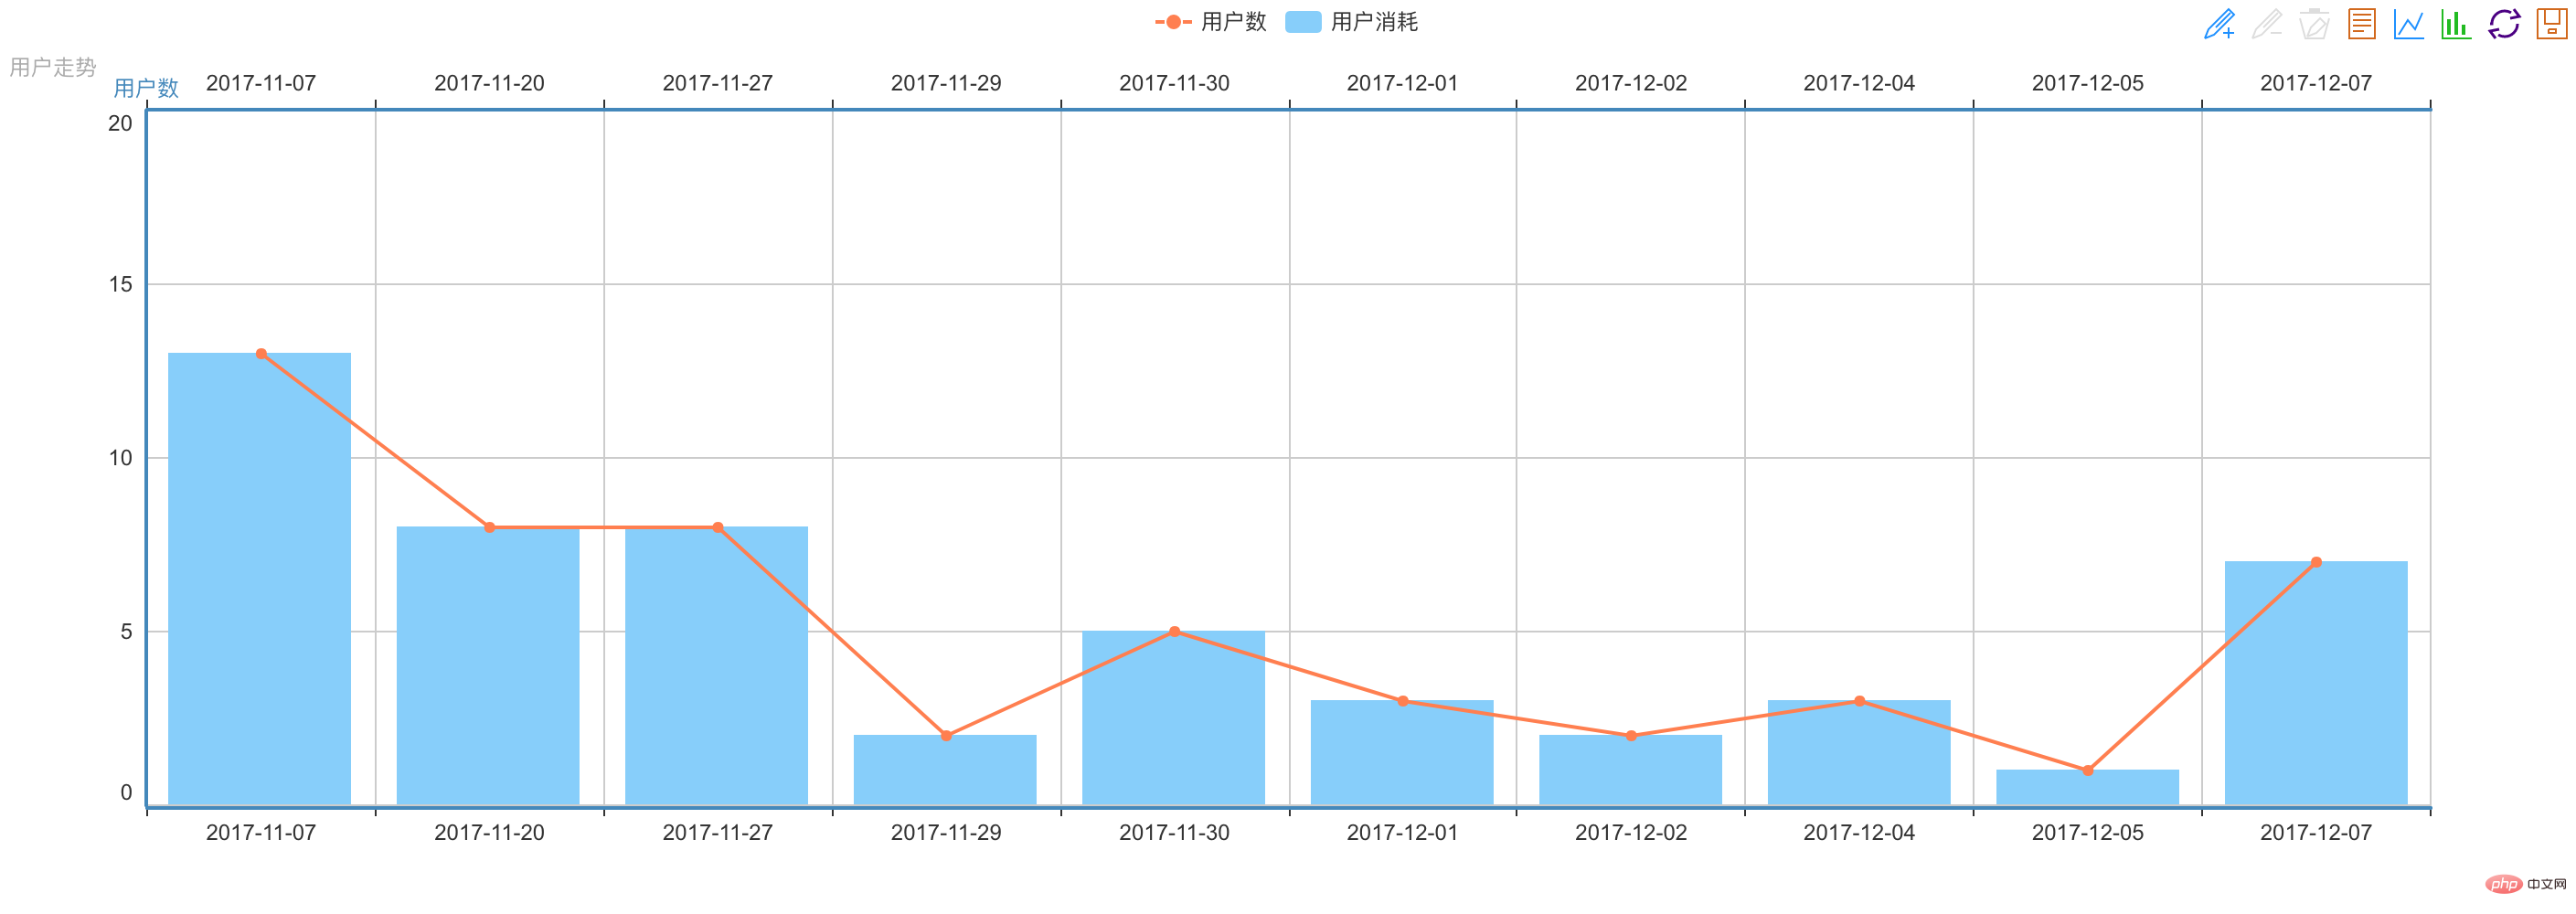
看下代码
HTML页面 为ECharts准备一个Dom,宽高自定义
<div class="panel panel-info">
<div class="panel-body">
<div id="echart_show" style="height:500px"></div>
</div>
</div>
登录后复制js文件可以参考官网,或者在这里下载,引入
<script type="text/javascript" src="__ROOT__/Public/admin/lib/jquery/nowdatachars/echarts-all.js"></script>
登录后复制下面是具体方法
<script type="text/javascript">

    var date = [],num = [];
    $(document).ready(function () {
        // 绘制反馈量图形
        var init_echarts = function () {
            var refreshChart = function (show_data) {
                my_demo_chart = echarts.init(document.getElementById('echart_show'));

                my_demo_chart.showLoading({
                    text: '加载中...',
                    effect: 'whirling'
                });

                var echarts_all_option = {
                    title: {
                        text: '',
                        subtext: '用户走势'
                    },
                    tooltip: {
                        trigger: 'axis'
                    },
                    legend: {
                        data: ['用户数', '用户消耗']
                    },
                    toolbox: {
                        show: true,
                        feature: {
                            mark: {show: true},
                            dataView: {show: true, readOnly: false},
                            magicType: {show: true, type: ['line', 'bar']},
                            restore: {show: true},
                            saveAsImage: {show: true}
//                            myTool2: {
//                                show: true,
//                                title: '自定义扩展方法',
//                                icon: 'image://http://echarts.baidu.com/images/favicon.png',
//                                onclick: function (){
//                                    alert('自定义')
//                                }
//                            }
                        }
                    },
                    dataZoom: {
                        show: false,
                        start: 0,
                        end: 100
                    },
                    xAxis: [
                        {
                            type: 'category',
                            boundaryGap: true,
                            data: show_data[1]
                        },
                        {
                            type: 'category',
                            boundaryGap: true,
                            data: show_data[1]
                        }
                    ],
                    yAxis: [
                        {
                            type: 'value',
                            scale: true,
                            name: '用户数',
                            boundaryGap: [0, 0.5]
//                            boundaryGap: [0.2, 0.2]
                        },
                        {
                            type: 'value',
                            scale: true,
                            name: '用户数',
                            boundaryGap: [0, 0.5]
                        }
                    ],
                    series: [
                        {
                            name: '用户消耗',
                            type: 'bar',
                            xAxisIndex: 1,
                            data: show_data[0]
                        },
                        {
                            name: '用户数',
                            type: 'line',
                            xAxisIndex: 1,
                            data:show_data[0]
                        }
                    ]
                };
                my_demo_chart.hideLoading();
                my_demo_chart.setOption(echarts_all_option);
            };

            // 获取原始数据
            $.ajax({
                url:"__CONTROLLER__/getRes",
                async:false,
                dataType:'json',
                type:'post',

                success:function(msg){
                    var result = msg.result;
                    if(msg.code == 200){
                        for(var i = 0 ; i < result.length; i++){
                            date.push(result[i].date);
                            num.push(result[i].count);
                            msg[0] = num;
                            msg[1] = date;
                            refreshChart(msg);
                        }
                    }
                }
            });
        };

        // 默认加载
        var default_load = (function () {
            init_echarts();
        })();
    });


</script>登录后复制
控制器中查询自己需要的数据 (这里查询的日期和对应的数量)
//折线统计
    public function getRes(){
        $user = M('account');
        $sql = "SELECT date(createTime) AS date,count(*) as count FROM t_account  GROUP BY date ";
        $result = $user->query($sql);
        $this->ajaxReturn(array('code'=>200,'result'=>$result));
    }登录后复制
至此,一个简单的echarts的统计图就出来了
对echarts中一些参数不太理解的,大家可以参考官网 https://www.echartsjs.com/option.html#title
以上就是PHP如何使用Echarts生成数据统计报表的详细内容,更多请关注靠谱客其它相关文章!

最后
以上就是纯情面包最近收集整理的关于PHP如何使用Echarts生成数据统计报表的全部内容,更多相关PHP如何使用Echarts生成数据统计报表内容请搜索靠谱客的其他文章。
本图文内容来源于网友提供,作为学习参考使用,或来自网络收集整理,版权属于原作者所有。


发表评论 取消回复