上篇博文我们自己训练了一个ANN
这次我们用ANN来对客户流失数据进行建模与预测
相关代码与源文件可以从我的GitHub地址获取
https://github.com/liuzuoping/Deep_Learning_note
读取客户流失数据
import pandas
df = pandas.read_csv('../data/customer_churn.csv', index_col=0, header = 0)
数据前处理
df = df.iloc[:,3:]
cat_var = ['international_plan','voice_mail_plan', 'churn']

for var in cat_var:
    df[var] = df[var].map(lambda e: 1 if e == 'yes' else 0)
y = df.iloc[:,-1]
x = df.iloc[:,:-1]
区分训练与测试数据集
from sklearn.model_selection import train_test_split
x_train, x_test, y_train, y_test = train_test_split(x, y, test_size = 0.33, random_state = 123)
尺度标准化
from sklearn.preprocessing import StandardScaler
sc = StandardScaler()
x_train = sc.fit_transform(x_train)
x_test = sc.fit_transform(x_test)
建立ANN
import keras
from keras.models import Sequential
from keras.layers import Dense
from keras.wrappers.scikit_learn import KerasClassifier
from sklearn.model_selection import cross_val_score

classifier = Sequential()
classifier.add(Dense(units = 8, kernel_initializer = 'uniform', activation = 'relu', input_dim = 16))
classifier.add(Dense(units = 8, kernel_initializer = 'uniform', activation = 'relu'))
classifier.add(Dense(units = 1, kernel_initializer = 'uniform', activation = 'sigmoid'))
classifier.compile(loss='binary_crossentropy',
              optimizer='adam',
              metrics=['accuracy'])

history = classifier.fit(x_train, y_train,
                    batch_size=10,
                    epochs=100,
                    validation_data=(x_test, y_test))
评估ANN
y_pred = classifier.predict(x_test)
y_pred
array([[0.6983981 ],
[0.03432922],
[0.02992912],
…,
[0.02928437],
[0.00207323],
[0.04132622]], dtype=float32)
predicted = (y_pred > 0.5).flatten().astype(int)
predicted
array([1, 0, 0, …, 0, 0, 0])
from sklearn.metrics import confusion_matrix
confusion_matrix(y_test, predicted)
array([[923, 27],
[ 52, 98]])
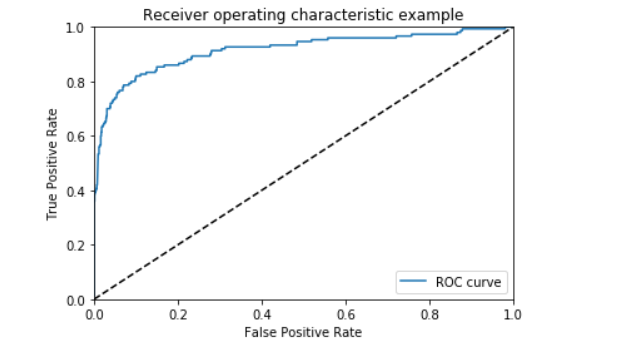
from sklearn.metrics import roc_curve
fpr_ary, tpr_ary, thresholds = roc_curve(y_test, y_pred)
%pylab inline
import matplotlib.pyplot as plt
plt.plot(fpr_ary, tpr_ary, label='ROC curve')
plt.plot([0, 1], [0, 1], 'k--')
plt.xlim([0.0, 1.0])
plt.ylim([0.0, 1.0])
plt.xlabel('False Positive Rate')
plt.ylabel('True Positive Rate')
plt.title('Receiver operating characteristic example')
plt.legend(loc="lower right")
plt.show()

from sklearn.metrics import auc
auc(fpr, tpr)
0.9205543859649123
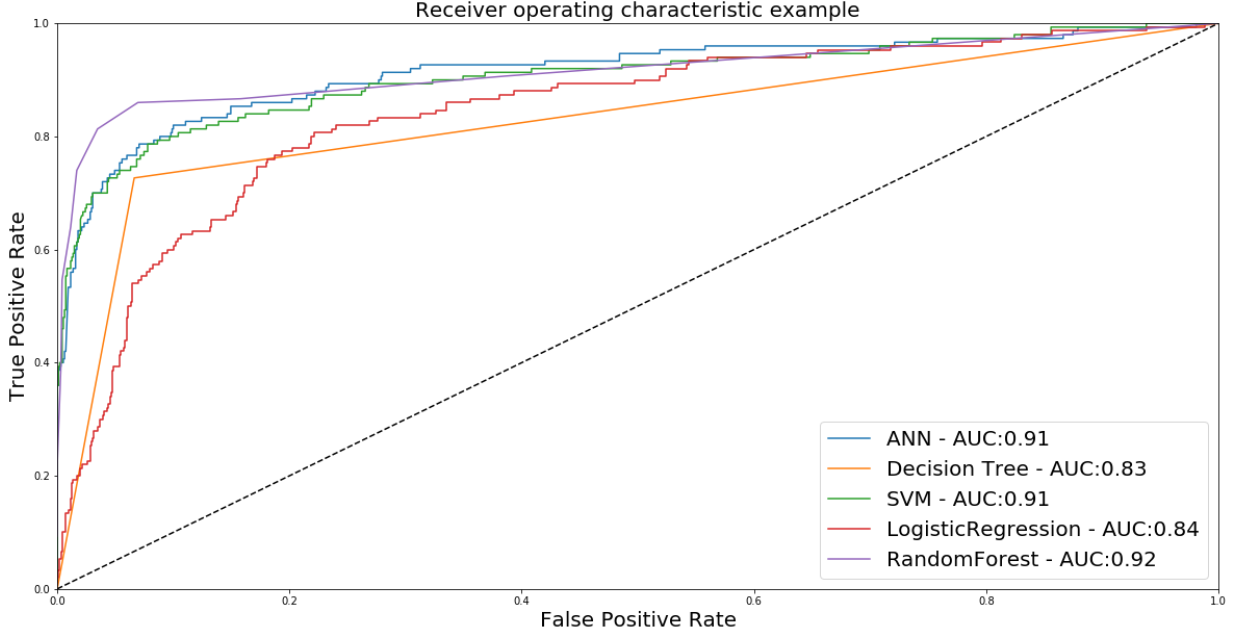
使用ROC Curve比较模型
from sklearn.tree import DecisionTreeClassifier
from sklearn.svm import SVC
from sklearn.linear_model import LogisticRegression
from sklearn.ensemble import RandomForestClassifier

clf1 = DecisionTreeClassifier()
clf1.fit(x_train, y_train)

clf2 = SVC(probability = True)
clf2.fit(x_train, y_train)

clf3 = LogisticRegression()
clf3.fit(x_train, y_train)

clf4 = RandomForestClassifier()
clf4.fit(x_train, y_train)
RandomForestClassifier(bootstrap=True, class_weight=None, criterion=‘gini’,
max_depth=None, max_features=‘auto’, max_leaf_nodes=None,
min_impurity_decrease=0.0, min_impurity_split=None,
min_samples_leaf=1, min_samples_split=2,
min_weight_fraction_leaf=0.0, n_estimators=10, n_jobs=1,
oob_score=False, random_state=None, verbose=0,
warm_start=False)
from sklearn.metrics import auc
from sklearn.metrics import roc_curve
import matplotlib.pyplot as plt

plt.figure(figsize= [20,10])
for clf, title in zip([classifier,clf1,clf2,clf3, clf4], ['ANN','Decision Tree', 'SVM', 'LogisticRegression', 'RandomForest']):
    if title != 'ANN':
        probas_ = clf.fit(x_train, y_train).predict_proba(x_test)
        fpr, tpr, thresholds = roc_curve(y_test, probas_[:, 1])
    else:
        y_pred = clf.predict(x_test)
        fpr, tpr, thresholds = roc_curve(y_test, y_pred)
    plt.plot(fpr, tpr, label='%s - AUC:%.2f'%(title, auc(fpr, tpr)) )

plt.plot([0, 1], [0, 1], 'k--')
plt.xlim([0.0, 1.0])
plt.ylim([0.0, 1.0])
plt.xlabel('False Positive Rate', fontsize = 20)
plt.ylabel('True Positive Rate', fontsize = 20)
plt.title('Receiver operating characteristic example', fontsize = 20)
plt.legend(loc="lower right", fontsize = 20)
plt.show()

最后
以上就是单纯季节最近收集整理的关于深度学习实战——客户流失数据建模的全部内容,更多相关深度学习实战——客户流失数据建模内容请搜索靠谱客的其他文章。


发表评论 取消回复