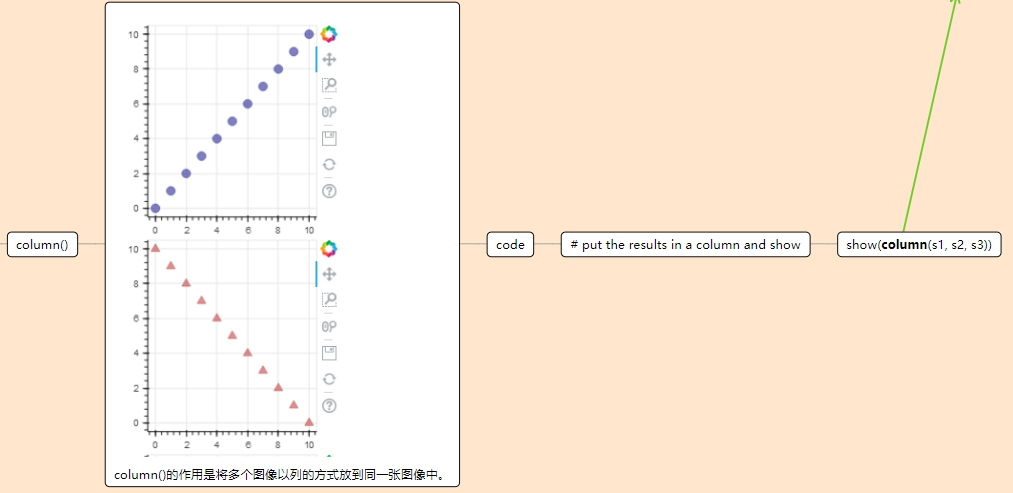
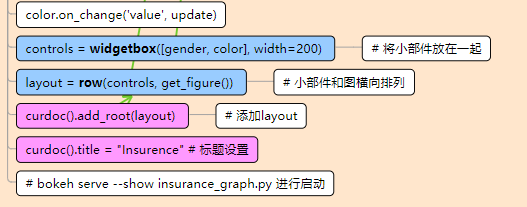
与上张图只有一处不同


参考文献:https://stackoverflow.com/questions/24985038/display-bokeh-generated-file-using-tornado
https://blog.csdn.net/tonydz0523/article/details/85717958?ops_request_misc=%257B%2522request%255Fid%2522%253A%2522160566144819195264760204%2522%252C%2522scm%2522%253A%252220140713.130102334…%2522%257D&request_id=160566144819195264760204&biz_id=0&utm_medium=distribute.pc_search_result.none-task-blog-2allsobaiduend~default-1-85717958.first_rank_ecpm_v3_pc_rank_v2&utm_term=bokeh+serve&spm=1018.2118.3001.4449
https://blog.csdn.net/tankloverainbow/article/details/80442289
https://docs.bokeh.org/en/latest/docs/reference/plotting.html
bokeh
bokeh 综述
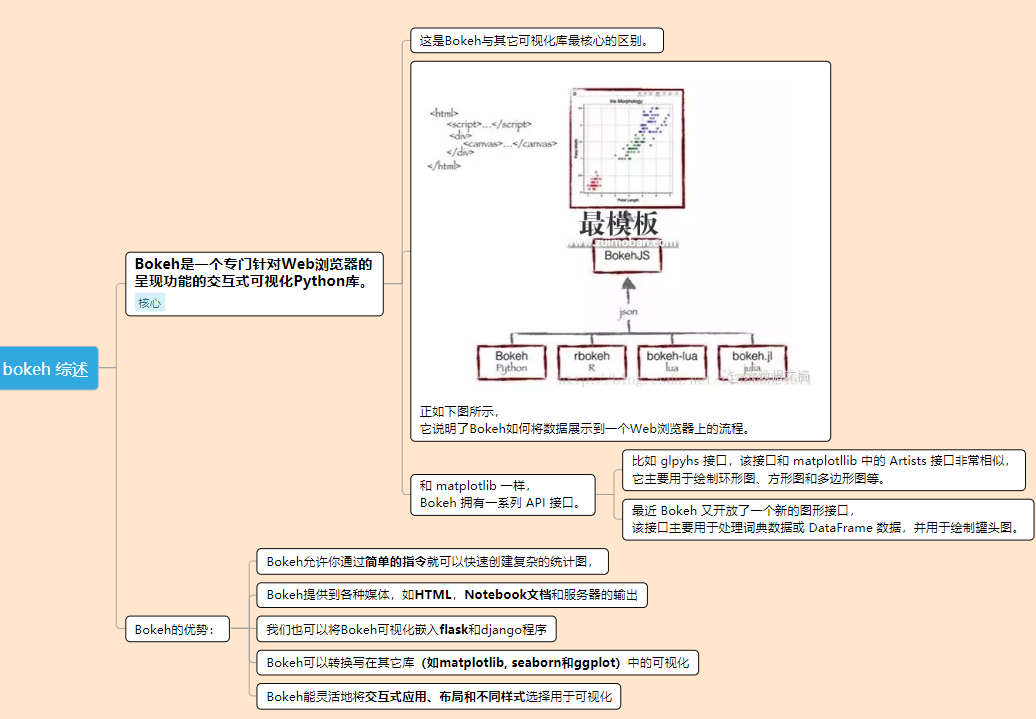
oBokeh是一个专门针对Web浏览器的呈现功能的交互式可视化Python库。
这是Bokeh与其它可视化库最核心的区别。
正如下图所示,它说明了Bokeh如何将数据展示到一个Web浏览器上的流程。
和 matplotlib 一样,Bokeh 拥有一系列 API 接口。
比如 glpyhs 接口,该接口和 matplotllib 中的 Artists 接口非常相似,它主要用于绘制环形图、方形图和多边形图等。
最近 Bokeh 又开放了一个新的图形接口,该接口主要用于处理词典数据或 DataFrame 数据,并用于绘制罐头图。
oBokeh的优势:
Bokeh允许你通过简单的指令就可以快速创建复杂的统计图,
Bokeh提供到各种媒体,如HTML,Notebook文档和服务器的输出
我们也可以将Bokeh可视化嵌入flask和django程序
Bokeh可以转换写在其它库(如matplotlib, seaborn和ggplot)中的可视化
Bokeh能灵活地将交互式应用、布局和不同样式选择用于可视化
用Bokeh实现可视化
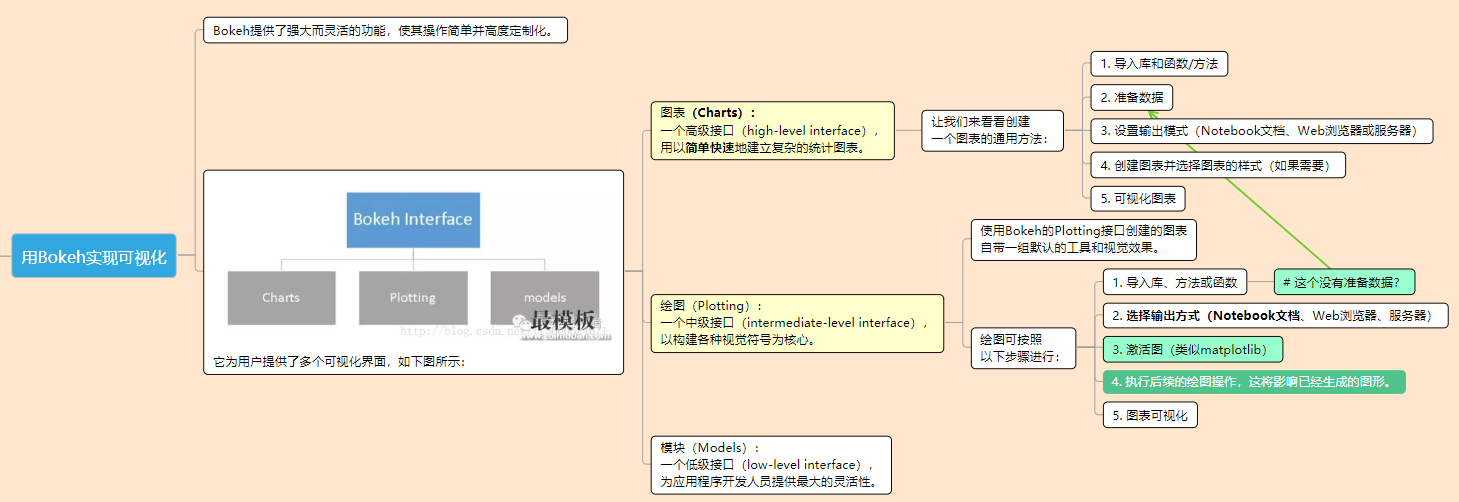
oBokeh提供了强大而灵活的功能,使其操作简单并高度定制化。
o它为用户提供了多个可视化界面,如下图所示:
图表(Charts):一个高级接口(high-level interface),用以简单快速地建立复杂的统计图表。
让我们来看看创建一个图表的通用方法:
o1. 导入库和函数/方法
o2. 准备数据
o3. 设置输出模式(Notebook文档、Web浏览器或服务器)
o4. 创建图表并选择图表的样式(如果需要)
o5. 可视化图表
绘图(Plotting):一个中级接口(intermediate-level interface),以构建各种视觉符号为核心。
使用Bokeh的Plotting接口创建的图表自带一组默认的工具和视觉效果。
绘图可按照以下步骤进行:
o1. 导入库、方法或函数
# 这个没有准备数据?
o2. 选择输出方式(Notebook文档、Web浏览器、服务器)
o3. 激活图(类似matplotlib)
o4. 执行后续的绘图操作,这将影响已经生成的图形。
o5. 图表可视化
模块(Models):一个低级接口(low-level interface),为应用程序开发人员提供最大的灵活性。
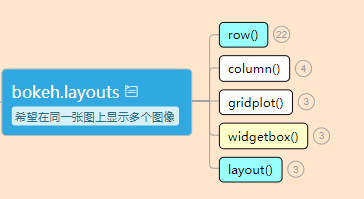
bokeh.layouts
https://blog.csdn.net/xc_zhou/article/details/84977449?ops_request_misc=%257B%2522request%255Fid%2522%253A%2522160566013419725225063487%2522%252C%2522scm%2522%253A%252220140713.130102334.pc%255Fall.%2522%257D&request_id=160566013419725225063487&biz_id=0&utm_medium=distribute.pc_search_result.none-task-blog-2allfirst_rank_v2~rank_v28-1-84977449.first_rank_ecpm_v3_pc_rank_v2&utm_term=bokeh.&spm=1018.2118.3001.4449
orow()
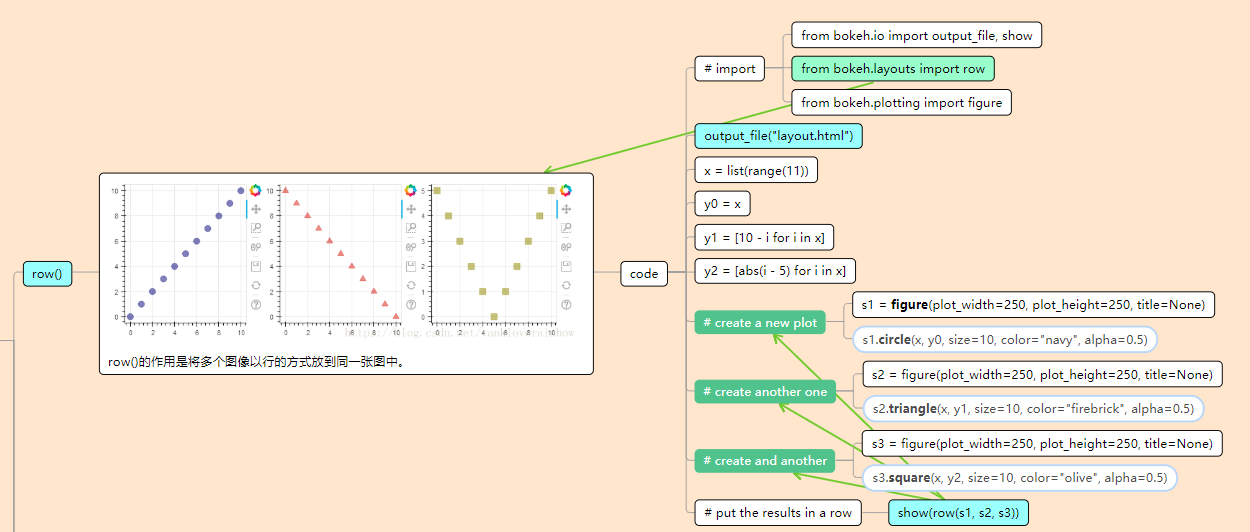
row()的作用是将多个图像以行的方式放到同一张图中。
code
o# import
from bokeh.io import output_file, show
from bokeh.layouts import row
from bokeh.plotting import figure
ooutput_file(“layout.html”)
ox = list(range(11))
oy0 = x
oy1 = [10 - i for i in x]
oy2 = [abs(i - 5) for i in x]
o# create a new plot
s1 = figure(plot_width=250, plot_height=250, title=None)
s1.circle(x, y0, size=10, color=“navy”, alpha=0.5)
o# create another one
s2 = figure(plot_width=250, plot_height=250, title=None)
s2.triangle(x, y1, size=10, color=“firebrick”, alpha=0.5)
o# create and another
s3 = figure(plot_width=250, plot_height=250, title=None)
s3.square(x, y2, size=10, color=“olive”, alpha=0.5)
o# put the results in a row
show(row(s1, s2, s3))
ocolumn()
column()的作用是将多个图像以列的方式放到同一张图像中。
code
o# put the results in a column and show
show(column(s1, s2, s3))
ogridplot()
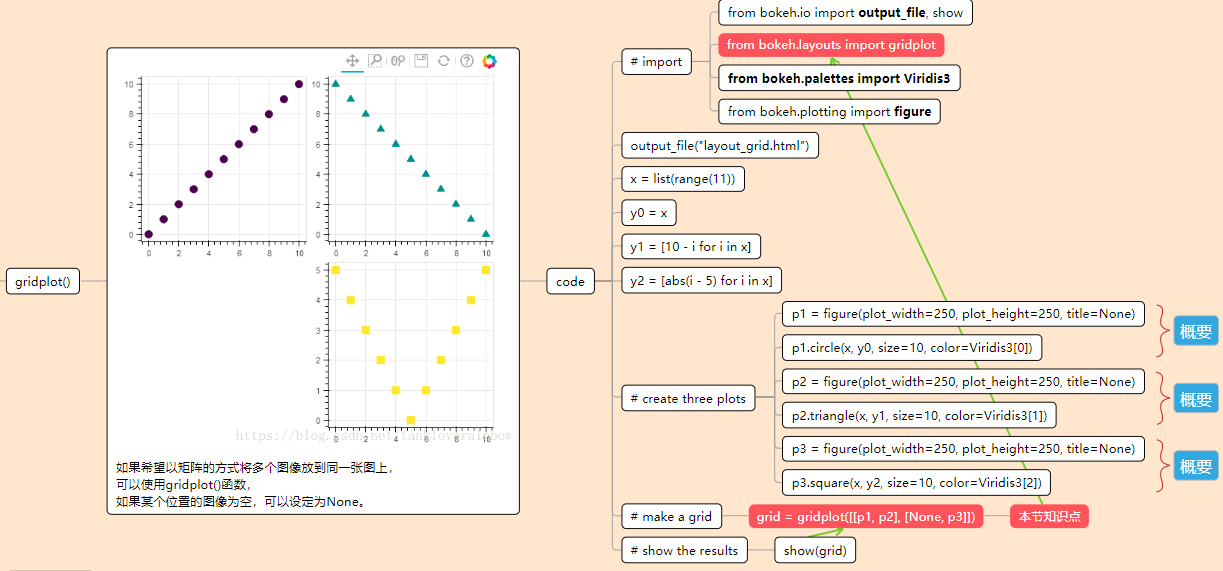
如果希望以矩阵的方式将多个图像放到同一张图上,可以使用gridplot()函数,如果某个位置的图像为空,可以设定为None。
code
o# import
from bokeh.io import output_file, show
from bokeh.layouts import gridplot
from bokeh.palettes import Viridis3
from bokeh.plotting import figure
ooutput_file(“layout_grid.html”)
ox = list(range(11))
oy0 = x
oy1 = [10 - i for i in x]
oy2 = [abs(i - 5) for i in x]
o# create three plots
p1 = figure(plot_width=250, plot_height=250, title=None)
p1.circle(x, y0, size=10, color=Viridis3[0])
p2 = figure(plot_width=250, plot_height=250, title=None)
p2.triangle(x, y1, size=10, color=Viridis3[1])
p3 = figure(plot_width=250, plot_height=250, title=None)
p3.square(x, y2, size=10, color=Viridis3[2])
o# make a grid
grid = gridplot([[p1, p2], [None, p3]])
本节知识点
o# show the results
show(grid)
owidgetbox()
如果希望在图像中插入widgets(小部件),可以使用widgetbox()函数。
code
ofrom bokeh.io import output_file, showfrom bokeh.layouts import widgetboxfrom bokeh.models.widgets import Button, RadioButtonGroup, Select, Slider output_file(“layout_widgets.html”) # create some widgetsslider = Slider(start=0, end=10, value=1, step=.1, title=“Slider”)button_group = RadioButtonGroup(labels=[“Option 1”, “Option 2”, “Option 3”], active=0)select = Select(title=“Option:”, value=“foo”, options=[“foo”, “bar”, “baz”, “quux”])button_1 = Button(label=“Button 1”)button_2 = Button(label=“Button 2”) # put the results in a rowshow(widgetbox(button_1, slider, button_group, select, button_2, width=300))
olayout()
layout()函数的作用有两个:
将多个图像按照矩阵样式摆放到同一张图中
输入参数可以是Plot, Widget, WidgetBox, Row, Column, ToolbarBox, Spacer,不仅限于Plot类
bokeh与tornado结合的三种方式
o1 bokeh生成一个html文件,由tornado来不断的去执行bokeh后生成新的html文件后,再去返回新的html
我之前用过这种方式,下面的链接也是这样方式
https://stackoverflow.com/questions/24985038/display-bokeh-generated-file-using-tornado
o2 bokeh作为一个tornado的一个应用端的库来使用
Embedding Bokeh Server as a Library
o3 tornado作为一个bokeh的客户端来使用
o注意:
倘若生成可以交互的方式的服务端的话,最好还是用bokeh serve 这种原生的方式
与tornado结合的方式更多的是为了展示数据使用。
另外,如果是实时流数据话,也是最好用bokeh serve原生的方式
bokeh.client.session
oProvide a session object to service Bokeh documents in external Python clients to a Bokeh server.
在外部Python客户端提供一个会话方面来服务散景文档到散景服务器
oUse-Cases
A client session has two primary uses:
Implementing automated testing infrastructure around Bokeh server applications.
Creating and customizing specific sessions of a Bokeh server application (running in the Bokeh server) before passing them on to a specific viewer.
o在将其传递到特定查看器之前,创建和定制散景服务器应用程序(在散景服务器中运行)的特定会话。
bokeh.io
https://blog.csdn.net/tankloverainbow/article/details/80464470?utm_medium=distribute.pc_relevant_t0.none-task-blog-BlogCommendFromMachineLearnPai2-1.channel_param&depth_1-utm_source=distribute.pc_relevant_t0.none-task-blog-BlogCommendFromMachineLearnPai2-1.channel_param
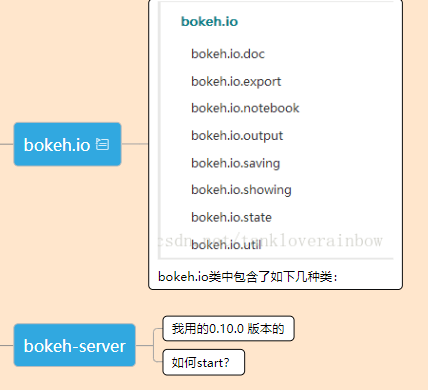
obokeh.io类中包含了如下几种类:
bokeh-server
o我用的0.10.0 版本的
o如何start?
使用Bokeh(下)——数据交互可视化
https://blog.csdn.net/tonydz0523/article/details/85717958?ops_request_misc=%257B%2522request%255Fid%2522%253A%2522160566144819195264760204%2522%252C%2522scm%2522%253A%252220140713.130102334…%2522%257D&request_id=160566144819195264760204&biz_id=0&utm_medium=distribute.pc_search_result.none-task-blog-2allsobaiduend~default-1-85717958.first_rank_ecpm_v3_pc_rank_v2&utm_term=bokeh+serve&spm=1018.2118.3001.4449
o数据回调
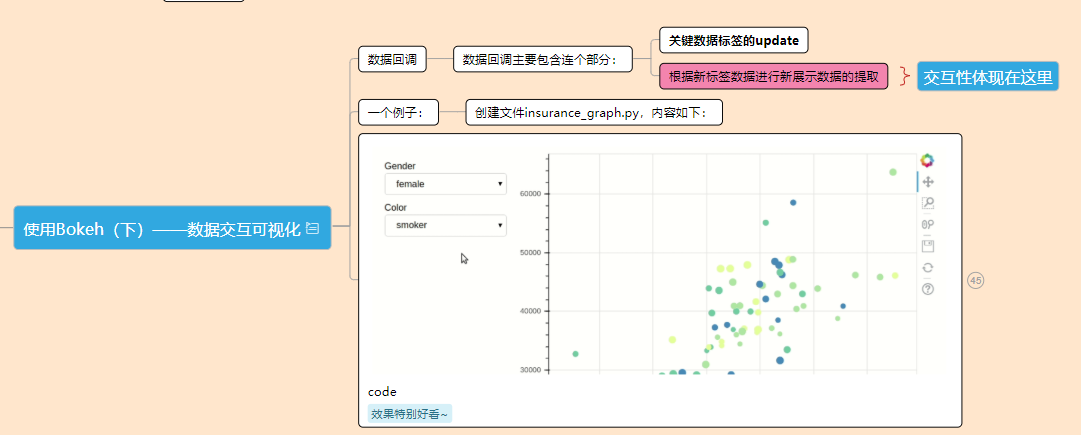
数据回调主要包含连个部分:
关键数据标签的update
根据新标签数据进行新展示数据的提取
o一个例子:
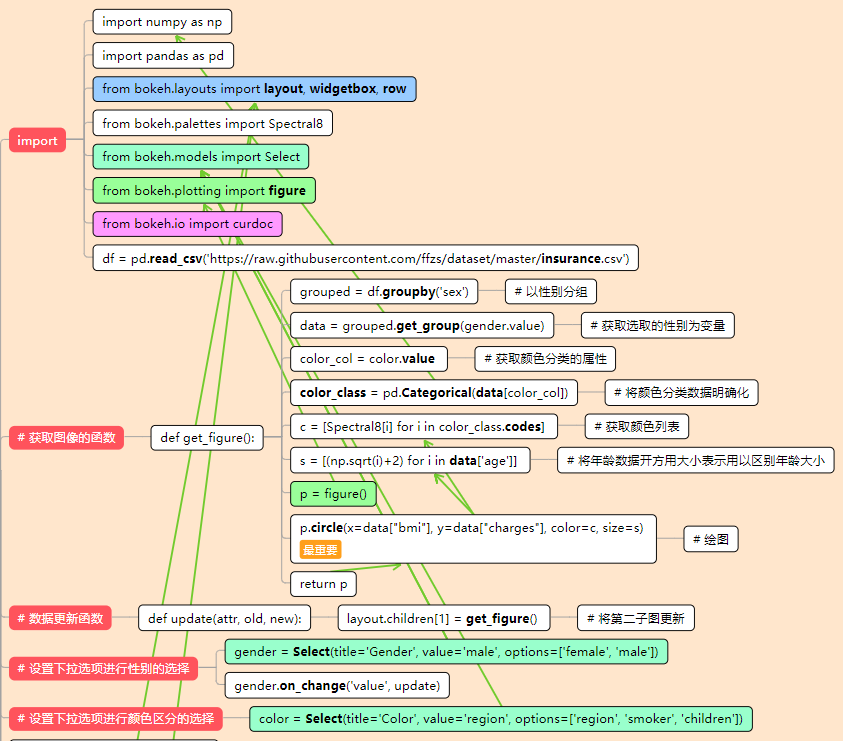
创建文件insurance_graph.py,内容如下:
ocode
import
import numpy as np
import pandas as pd
from bokeh.layouts import layout, widgetbox, row
from bokeh.palettes import Spectral8
from bokeh.models import Select
from bokeh.plotting import figure
from bokeh.io import curdoc
df = pd.read_csv(‘https://raw.githubusercontent.com/ffzs/dataset/master/insurance.csv’)
# 获取图像的函数
def get_figure():
o grouped = df.groupby(‘sex’)
# 以性别分组
o data = grouped.get_group(gender.value)
# 获取选取的性别为变量
o color_col = color.value
# 获取颜色分类的属性
o color_class = pd.Categorical(data[color_col])
# 将颜色分类数据明确化
o c = [Spectral8[i] for i in color_class.codes]
# 获取颜色列表
o s = [(np.sqrt(i)+2) for i in data[‘age’]]
# 将年龄数据开方用大小表示用以区别年龄大小
o p = figure()
o p.circle(x=data[“bmi”], y=data[“charges”], color=c, size=s)
# 绘图
o return p
# 数据更新函数
def update(attr, old, new):
o layout.children[1] = get_figure()
# 将第二子图更新
# 设置下拉选项进行性别的选择
gender = Select(title=‘Gender’, value=‘male’, options=[‘female’, ‘male’])
gender.on_change(‘value’, update)
# 设置下拉选项进行颜色区分的选择
color = Select(title=‘Color’, value=‘region’, options=[‘region’, ‘smoker’, ‘children’])
color.on_change(‘value’, update)
controls = widgetbox([gender, color], width=200)
# 将小部件放在一起
layout = row(controls, get_figure())
# 小部件和图横向排列
curdoc().add_root(layout)
# 添加layout
curdoc().title = “Insurence” # 标题设置
# bokeh serve --show insurance_graph.py 进行启动
正如下图所示,它说明了Bokeh如何将数据展示到一个Web浏览器上的流程。
如果希望在图像中插入widgets(小部件),可以使用widgetbox()函数。
如果希望以矩阵的方式将多个图像放到同一张图上,可以使用gridplot()函数,如果某个位置的图像为空,可以设定为None。
bokeh.io类中包含了如下几种类:
它为用户提供了多个可视化界面,如下图所示:
layout()函数的作用有两个:
row()的作用是将多个图像以行的方式放到同一张图中。
column()的作用是将多个图像以列的方式放到同一张图像中。
code
最后
以上就是笑点低板凳最近收集整理的关于【思维导图】bokeh 交互式可视化python库网络资料汇总的全部内容,更多相关【思维导图】bokeh内容请搜索靠谱客的其他文章。


发表评论 取消回复