作者: 江俊
日期: 2018年3月27日
主要介绍批量生成profiling图以及五数概括的自建函数。
项目背景
某保养品公司目前有一款产品线销售情况一直不景气,公司预算有限,希望在现有的客户中挖掘出最有可能在30天内购买该产品的用户群
使用语言
R语言
使用模型
逻辑回归+线性回归
建模步骤
一、 了解数据
- 数据结构
- Y变量定义
- X变量类型
- 响应率情况
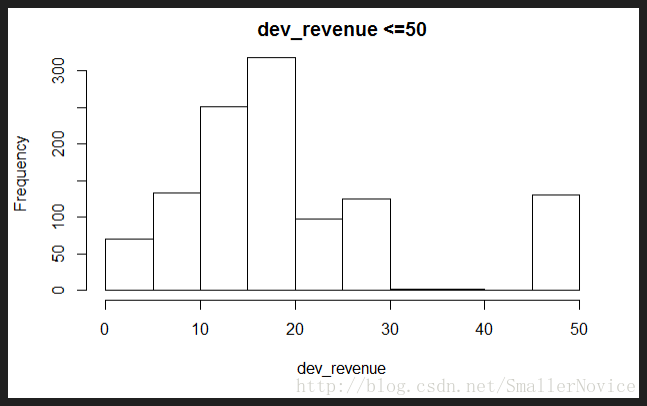
- 花费金额分布
代码:
rm(list=ls())
setwd("./") #change the location
getwd()      #check the location
list.files() #list the files under your location

#########################################################################
########################   Part1 read data    ###########################
#########################################################################
filepath<-"./Exercise_Response_data.csv"
raw<-read.csv(filepath,stringsAsFactors = F)

dim(raw)
str(raw)
summary(raw)
var<-data.frame(var=colnames(raw),type=sapply(raw,class))

# 将结果导出到 xlsx表格
require(XLConnect)
#xlsx <- loadWorkbook('Correlation.xlsx',create=TRUE)
xlsx <- loadWorkbook('myhomework.xlsx',create = T)
createSheet(xlsx,name='variable')  #name the worksheet as 'correlation'
writeWorksheet(xlsx,var,'variable',startRow=1,startCol=1, header=TRUE)  #define the startrow,startcol,header
saveWorkbook(xlsx)

# dv_revenue
  summary(raw$dv_revenue)
  raw$dv_revenue<-ifelse(is.na(raw$dv_revenue),0,raw$dv_revenue)
  # table 自动忽略缺失值
  View(table(raw$dv_revenue))
  hist(raw$dv_revenue)                         # dv_revenue hist
  quantile(raw$dv_revenue,(1:20)/20,na.rm = T) # dv_revenue quantile

  View(t(mean_rev<-quantile(raw$dv_revenue,c(0,0.01,0.1,0.25,0.5,0.75,0.9,0.99,1),na.rm = T)))

  hist(raw[raw$dv_revenue>0 & raw$dv_revenue<=50,"dv_revenue"],main="dev_revenue <=50",xlab = "dev_revenue")

# dv_response
  table(raw$dv_response)
  prop.table(table(raw$dv_response))
执行结果:

 0     1
22878  1220

         0          1
0.94937339 0.05062661
二、拆分数据
- train:训练集
- test:验证集
代码:
#########################################################################
########################   Part2 split into two    ######################
#########################################################################
# modeling segments
  table(raw$segment)
  prop.table(table(raw$segment))

#separate build sample
  train<-raw[raw$segment=="build",]
  table(train$segment)

#separate inval sample
  test<-raw[raw$segment=="inval",]
  table(test$segment)
执行结果:
build inval
16898  7200

  build   inval
0.70122 0.29878

build
16898

inval
 7200
三、 探索数据
- 分类型、数值型
- X内部表现
- X与Y关系
- 缺失值
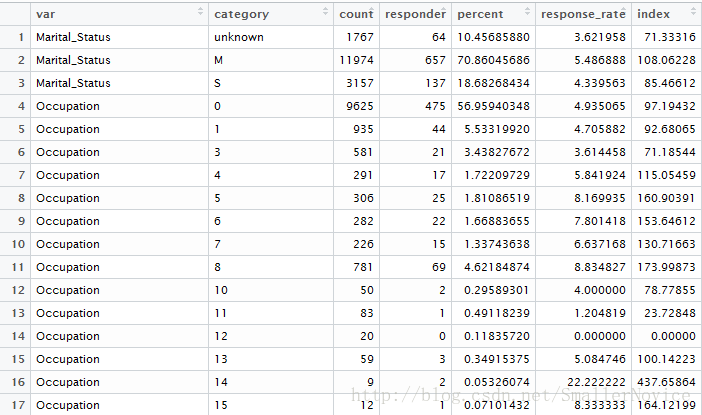
批量生成profiling图
代码:
#########################################################################
########################   Part3 profile     ############################
#########################################################################
  #overall performance
  #总体人数,计算总体样本响应情况
  overrall<-dim(train)[1]
  #相应人数,因为响应的记为1,所以可以直接使用sum()求和
  over_responder<-sum(train$dv_response)
  #responder<-length(train$dv_response[train$dv_response==1])
  #响应率
  over_response_rate<-over_responder/overrall
  overall_perf<-data.frame(overrall,responder=over_responder,response_rate=over_response_rate)
  overall_perf

  #variable type
  data.frame(table(sapply(train[,4:27],class)))

  #character
  #查看数据类型为某种的数据名,类似的有:is.character,is.numeric,is.factor
  chavar_name<-colnames(train[,4:27])[unlist(lapply(train[,4:27],is.character))]
  #字符型数据索引
  charater_index<-which(colnames(train) %in% chavar_name)
  lapply(train[,chavar_name],table)

  #整数型,注意可能是分类型数值
  intvar_name<-colnames(train[,4:27])[unlist(lapply(train[4:27],is.integer))]
  summary(train[,intvar_name])

  #根据结果记录分类型数值的变量名
  var_fenlei<-c(chavar_name,"Occupation","Education","Frequency_of_last_mth")
  lapply(train[,var_fenlei],table)
  #根据分类型和连续型将原数据集分成两类,方便后续profile的批量处理
  #分类型数值的索引
  fenlei_index<-which(colnames(train) %in% var_fenlei)

  #除开id列,响应变量列,字符型,分类型数值以外的连续数值型变量
  #which(colnames(train[,4:27]) %in% c("rid","dv_response","dv_revenue"))
  numvar_name<-colnames(train[,-c(1:3,fenlei_index,28:ncol(train))])

  #数值型数值的索引
  lianxu_index<-which(colnames(train) %in% numvar_name)

  ############################################### 1. Profiling for category variables####################################################
  #install.packages('plyr')
  library(plyr)

  ###################################### 1.profile 分类型数值 #########################################

  #封装函数,分类型数值
  #数据集,索引,索引长度
  profile_fenlei<-function(x,y,n){
    results<-data.frame(var=NA,category=NA,count=NA,responder=NA,
                        percent=NA,response_rate=NA,index=NA)
    for(i in 1:n){
      prof<-ddply(x,.(x[,y[i]]),summarise,count=length(id),responder=sum(dv_response)) #group by hh_gender_m_flg
      #prof
      #添加百分比结果
      propf<-within(prof,{
        index<-responder/count/over_response_rate*100
        response_rate<-responder/count*100
        percent<-count/overrall*100
      })  #add response_rate,index, percentage
      propf<-data.frame(var=colnames(train)[y[i]],propf)
      colnames(propf)[2]<-"category"
      #行连接
      results<-rbind(results,propf)
    }
    #去除首行的空值
    results<-results[-1,]
    row.names(results)<-1:nrow(results)
    return(results)
  }
  #分类数值的profile
  results_fenlei<-profile_fenlei(train[,1:28],fenlei_index,length(fenlei_index))
  results_fenlei$category[is.na(results_fenlei$category)]<-"unknown"
  results_fenlei$category[results_fenlei$category==""]<-"unknown"
  View(results_fenlei)

  # #xlsx <- loadWorkbook('Correlation.xlsx',create=TRUE)
  # xlsx <- loadWorkbook('myhomework.xlsx')
  # createSheet(xlsx,name='profile')  #name the worksheet as 'correlation'
  # writeWorksheet(xlsx,results_fenlei,'profile',startRow=1,startCol=1, header=TRUE)  #define the startrow,startcol,header
  # saveWorkbook(xlsx)
  #
  #
  ###################################### 1.profile 分类型数值 #########################################

  #####################################  2.profile 连续型数值 #########################################

  ######封装函数
  #数据集,索引,索引长度,分段个数
  profile_lianxu<-function(x,y,n,m){
    var_data=x
    results<-data.frame(var=NA,category=NA,count=NA,responder=NA,
                        percent=NA,response_rate=NA,index=NA)
    for(i in 1:n){
      #分离成两部分:缺失值和无缺失值
      nomissing<-data.frame(var_data[!is.na(var_data[,y[i]]),]) #select the no missing value records
      missing<-data.frame(var_data[is.na(var_data[,y[i]]),])    #select the missing value records
      ##################3.2.1 numeric Profiling:missing part
      missing2<-ddply(missing,.(missing[,y[i]]),summarise,count=length(id),responder=sum(dv_response)) #group by pos_revenue_base_sp_6mo
      colnames(missing2)[1]<-"category"
      #View(missing2)
      missing_perf<-within(missing2,{
        index<-responder/count/over_response_rate*100
        response_rate<-responder/count*100
        percent<-count/overrall*100
      })
      #View(missing_perf)
      nomissing_value<-nomissing[,y[i]]  #put the nomissing values into a variable

      nomissing$category<-cut(nomissing_value,unique(quantile(nomissing_value,(0:m)/m)),include.lowest = T) #separte into 10 groups
      #View(table(nomissing$var_category))  #take a look at the 10 category
      prof2<-ddply(nomissing,.(category),summarise,count=length(id),responder=sum(dv_response))#group by the 10 groups
      #View(prof2)
      nonmissing_perf<-within(prof2,{
        index<-responder/count/over_response_rate*100
        response_rate<-responder/count*100
        percent<-count/overrall*100
      })#add avg_revenue,index,percent
      #View(nonmissing_perf)
      #set missing_perf and non-missing_Perf together
      #View(missing_perf)
      #View(nonmissing_perf)
      #colnames(nonmissing_perf)[3]<-"responder"
      lastprofile<-rbind(nonmissing_perf,missing_perf) #set 2 data together
      lastprofile<-data.frame(var=colnames(train)[y[i]],lastprofile)
      #行连接
      results<-rbind(results,lastprofile)
    }
    #去除首行的空值
    results<-results[-1,]
    row.names(results)<-1:nrow(results)
    return(results)
  }
  #连续数值的profile
  results_lianxu<-profile_lianxu(train[,1:34],lianxu_index,length(lianxu_index),10)
  results_lianxu$category[is.na(results_lianxu$category)]<-"unknown"
  View(results_lianxu)
  ######封装函数
#####################################  2.profile 连续型数值 #########################################

    #将两个 profile 合成一个整体,输出到xlsx表格

  #xlsx <- loadWorkbook('Correlation.xlsx',create=TRUE)
  final_profile<-rbind(results_fenlei,results_lianxu)
  View(final_profile)
  xlsx <- loadWorkbook('myhomework.xlsx')
  createSheet(xlsx,name='profile')  #name the worksheet as 'correlation'
  writeWorksheet(xlsx,final_profile,'profile',startRow=1,startCol=1, header=T)  #define the startrow,startcol,header
  saveWorkbook(xlsx)
执行结果(部分截图):

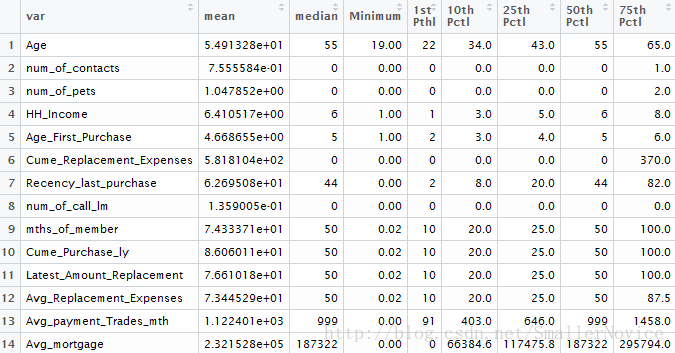
生成连续型数值的五数概括
代码:
#########################################################################
########################   Part4 means     ##############################
#########################################################################
  # 连续性数据的五数概括
  dat_n<-train[,lianxu_index]
  mean_var<-data.frame(var=1:ncol(dat_n),mean=NA,median=NA,"0%"=NA,
                       "1%"=NA,"10%"=NA,"25%"=NA,"50%"=NA,
                       "75%"=NA,"90%"=NA,"99%"=NA,"100%"=NA,
                       max=NA,missing=NA)
  colnames(mean_var)[4:12]<-c("Minimum","1st Pthl","10th Pctl","25th Pctl","50th Pctl","75th Pctl","90th Pctl",
                              "99th Pctl","Maximum")
  for(i in 1:ncol(dat_n)){
    mean_var$var[i]=colnames(dat_n)[i]
    mean_var$mean[i]=mean(dat_n[,i],na.rm=TRUE)   #na.rm=TRUE去除NA的影响
    mean_var$median[i]=median(dat_n[,i],na.rm=TRUE)
    mean_var[i,4:12]=quantile(dat_n[,i],c(0,0.01,0.1,0.25,0.5,0.75,0.9,0.99,1),na.rm=TRUE)
    mean_var$max[i]=max(dat_n[,i],na.rm=TRUE)
    mean_var$missing[i]=sum(is.na(dat_n[,i]))
  }
  # #销毁临时变量
  # dat_n<-NULL
  #在列表中查看数值变量的统计信息
  View(mean_var)

  # 导出到 xlsx 表格
  xlsx <- loadWorkbook('myhomework.xlsx')
  createSheet(xlsx,name='means')  #name the worksheet as 'correlation'
  writeWorksheet(xlsx,mean_var,'means',startRow=1,startCol=1, header=T)  #define the startrow,startcol,header
  saveWorkbook(xlsx)
执行结果(部分截图):

未完待续。。。
转载请注明出处
最后
以上就是醉熏飞机最近收集整理的关于数据分析学习体验——实际案例_逻辑回归&线性回归的全部内容,更多相关数据分析学习体验——实际案例_逻辑回归&线性回归内容请搜索靠谱客的其他文章。
本图文内容来源于网友提供,作为学习参考使用,或来自网络收集整理,版权属于原作者所有。


发表评论 取消回复