参考官网:matplotlib.pyplot.bar
matplotlib.pyplot.bar(x, height, width=0.8, bottom=None, *, align=‘center’, data=None, **kwargs)
x:要显示的x轴的数据序列。
height:要显示的y轴的数据序列。
使用bar绘制堆叠的柱状图
代码如下:
# TODO: 画出device_conn_type和CTR相关的histogram, 参考问题6的效果图。
# import matplotlib.ticker as ticker
x = sorted(list(data_df['device_conn_type'].unique()))
y_0 = []
y_1 = []
for i in x:
    length = len(data_df[data_df['device_conn_type']==i])
    rate_0 = len(data_df[(data_df['click']==0) & (data_df['device_conn_type']==i)])/length
    rate_1 = len(data_df[(data_df['click']==1) & (data_df['device_conn_type']==i)])/length
    y_0.append(rate_0)
    y_1.append(rate_1)

print(y_0)
print(y_1)
# 使用bar()来绘制堆叠柱状图
plt.bar(range(len(x)), y_0, width=0.5, color='red', label=0)
plt.bar(range(len(x)), y_1, width=0.5, color='blue', label=1, bottom=y_0)
plt.title("CTR for device_conn_type feature")
plt.xlabel("device_conn_type")
plt.xticks(range(len(x)), x)
plt.legend(title='click', loc='lower right')
# plt.xticks(rotation=90)    # 设置横坐标标签旋转角度。
plt.show()
如果只是按照官网提供的代码画柱状图,x轴将按顺序显示。如1,2,3…
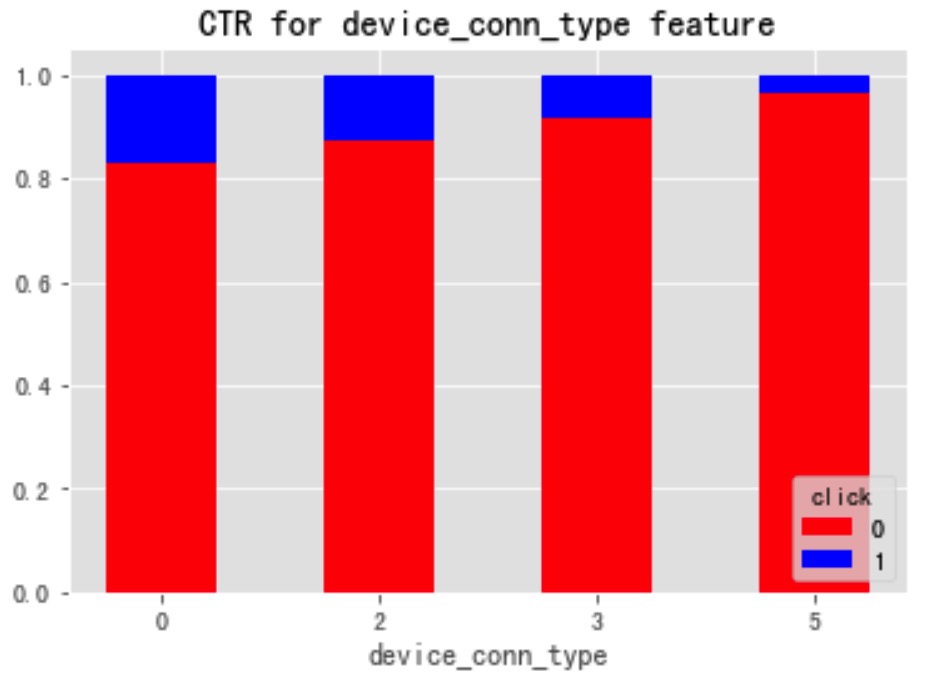
此处借助 plt.xticks 对x轴进行自定义刻度,可显示为0,2,3,5。将bar中的x设置为range(len(x)),再通过plt.xticks来设置x显示的刻度值,plt.xticks(range(len(x)),x),其中参数1为长度,参数x为要显示的值的具体内容。xticks的参数 rotation 可以设置x轴刻度的显示旋转方向。
效果如下图所示:

最后
以上就是仁爱缘分最近收集整理的关于matplotlib.pyplot.bar的使用——绘制堆叠柱状图的全部内容,更多相关matplotlib.pyplot.bar内容请搜索靠谱客的其他文章。
本图文内容来源于网友提供,作为学习参考使用,或来自网络收集整理,版权属于原作者所有。


发表评论 取消回复