yolov3中需读取自己数据的xml文件,用kmeans算法,来生成合理的9个具有长宽的anchor先验框,以便更好地训练自己的数据。
若您没有自己的xml数据集:请点击此链接:https://github.com/caichunbing/kmeans/blob/master/xml.zip下载。
#================================================================
# Copyright (C) 2019 * Ltd. All rights reserved.
#
# Editor : pycharm
# File name : kmeans.py
# Author : caichunbing
# Created date: 2019-10-18
# Description :yolov3-kmeans聚类算法及可视化
#
#================================================================
import numpy as np
import matplotlib.pyplot as plt
import glob
import xml.etree.ElementTree as ET
def loadDataSet(xml_filepath): # general function to parse tab -delimited floats
dataMat = [] # assume last column is target value
for xml_file in glob.glob(xml_filepath + '/*.xml'):
tree = ET.parse(xml_file)
root = tree.getroot()
for obj in root.findall('object'):
bbox = obj.find('bndbox')
xmin = bbox.find('xmin').text.strip()
xmax = bbox.find('xmax').text.strip()
ymin = bbox.find('ymin').text.strip()
ymax = bbox.find('ymax').text.strip()
w=float(xmax)-float(xmin)
h=float(ymax)-float(ymin)
dataMat.append([w,h])
return np.mat(dataMat)
def distEclud(vecA, vecB):
dist=np.sqrt(np.sum(np.power(vecA - vecB, 2)))
return dist # la.norm(vecA-vecB)
def randCent(dataSet, k):
n = np.shape(dataSet)[1]
centroids = np.mat(np.zeros((k, n))) # create centroid mat
for j in range(n): # create random cluster centers, within bounds of each dimension
minJ = min(dataSet[:, j])
rangeJ = float(max(dataSet[:, j]) - minJ)
centroids[:, j] = np.mat(minJ + rangeJ * np.random.rand(k, 1))
return centroids
def kMeans(dataSet, k, distMeas=distEclud, createCent=randCent):
m = np.shape(dataSet)[0]
clusterAssment = np.mat(np.zeros((m, 2))) # create mat to assign data points
# to a centroid, also holds SE of each point
centroids = createCent(dataSet, k)
clusterChanged = True
while clusterChanged:
clusterChanged = False
for i in range(m): # for each data point assign it to the closest centroid
minDist = np.inf
minIndex = -1
for j in range(k):
distJI = distMeas(centroids[j, :], dataSet[i, :])
if distJI < minDist:
minDist = distJI
minIndex = j
if clusterAssment[i, 0] != minIndex: clusterChanged = True
clusterAssment[i, :] = minIndex, minDist ** 2
for cent in range(k): # recalculate centroids
ptsInClust = dataSet[np.nonzero(clusterAssment[:, 0].A == cent)[0]] # get all the point in this cluster
centroids[cent, :] = np.mean(ptsInClust, axis=0) # assign centroid to mean
return centroids, clusterAssment
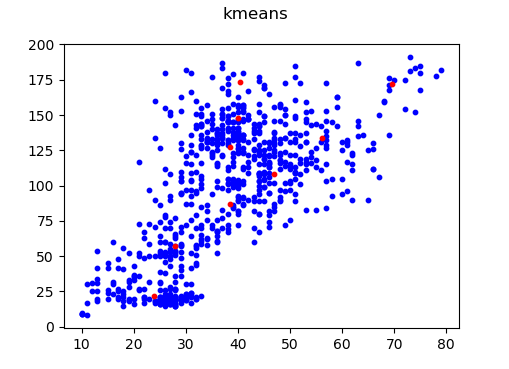
def show(w,h,centroid_w,centroid_h):
fig = plt.figure()
fig.suptitle("kmeans")
ax1 = fig.add_subplot(1, 1, 1)
ax1.scatter(w, h, s=10, color='b')
ax1.scatter(centroid_w,centroid_h,s=10,color='r')
plt.show()
def write_anchors(centroid,anchor_path):
f=open(anchor_path,"w")
#获得按面积从小到大排序的索引,根据面积从小到大写入到anchors文件
dict={}
for i in range(len(centroid)):
area=centroid[i][0]*centroid[i][1]
dict[i]=area
list = sorted(dict.items(), key=lambda x: x[1])
str_line=""
for i in range(len(centroid)):
for j in range(len(centroid[0])):
print(centroid[list[i][0]][j])
str_line+=str(round(centroid[list[i][0]][j],1))+','
f.write(str_line[0:-1])
xml_filepath="./after_image_xml/xml/train"
anchor_path="./anchors/anchors.txt"
if __name__ == '__main__':
dataSet=loadDataSet(xml_filepath)
print("dataSet.shape:",dataSet.shape)
centroid,cluster=kMeans(dataSet, 9,distEclud,randCent)
count=1
#此处循环是为了让centroid不生成含有nan的值为止
while np.all(np.isnan(centroid) == False) !=True:
print("count:",count)
centroid, cluster = kMeans(dataSet, 9, distEclud, randCent)
count+=1
write_anchors(centroid.tolist(), anchor_path)
w = dataSet[:, 0].tolist()
h = dataSet[:, 1].tolist()
centoid_w=centroid[:,0].tolist()
centoid_h=centroid[:,1].tolist()
show(w,h,centoid_w,centoid_h)
anchors.txt中数据如下:
9个anchor框,按面积从小到大排列
25.1,19.2,19.9,32.7,26.5,52.9,32.4,69.8,37.5,104.1,45.3,87.2,39.8,141.9,49.3,121.8,53.4,170.1
可视化如下图:
最后
以上就是陶醉荔枝最近收集整理的关于yolov3-kmeans算法计算先验anchor的python实现的全部内容,更多相关yolov3-kmeans算法计算先验anchor内容请搜索靠谱客的其他文章。
本图文内容来源于网友提供,作为学习参考使用,或来自网络收集整理,版权属于原作者所有。


发表评论 取消回复