大疆多光谱简介
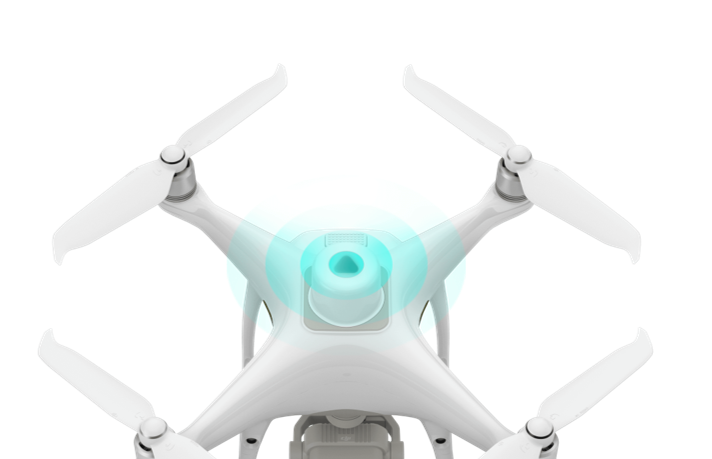
大疆多光谱无人机顶部设置了辐射传感器,可捕捉太阳辐照度并记录于影像文件中,当进行数据后期处理时,太阳辐照度数据将可用于对影像进行光照补偿,排除环境光对数据采集的干扰,有助于使用者获得更准确的 NDVI 结果,提高不同时段采集到的数据的准确度与一致性。
但很多人说可能不准,因此本文对大疆的辐射数据进行提取查看结果
波段分类
首先对获取的无人机图片根据波段分类,可以参照Python分类文件(大疆精灵4多光谱版PM4影象分类)。
实现代码
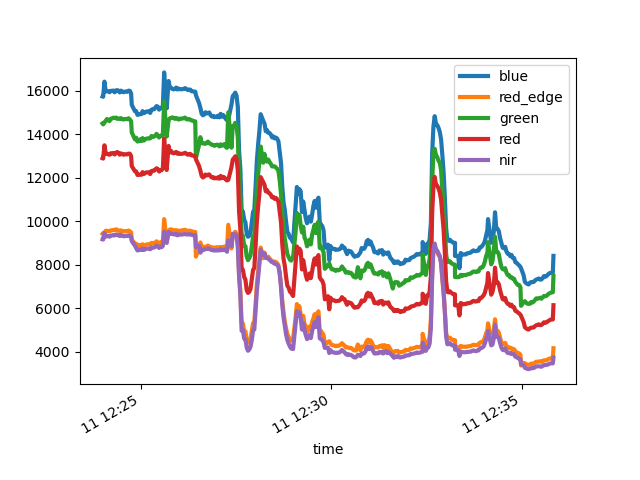
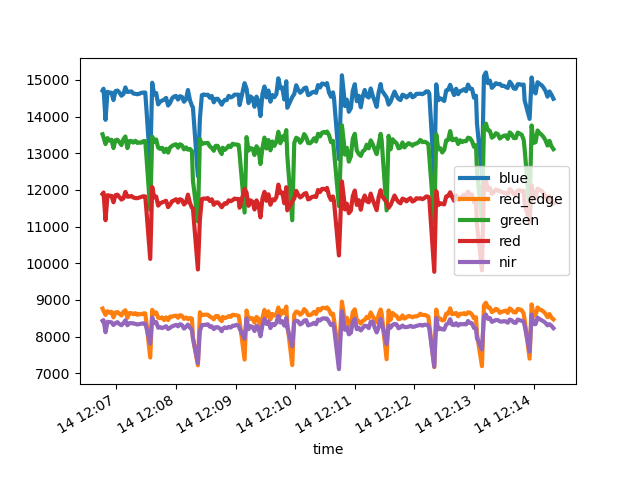
分别分析了多云和晴天的情况
信息获取
import os
from pyexiv2 import Image
import progressbar
import pandas as pd
import matplotlib.pyplot as plt


def image_info(imagepath):
    """获取xmp、xeif信息"""

    img = Image(imagepath)
    exif = img.read_exif()  # 读取 EXIF 元数据,这会返回一个字典
    xmp = img.read_xmp()
    img.close()  # 操作完之后,记得关闭图片

    return xmp, exif


def get_all_files(dir):
    """
    获取文件夹列表函数
    :param dir: 文件夹所在位置
    :return: 文件夹内文件名称列表
    """
    files_ = []
    lit = os.listdir(dir)
    for i in range(0, len(lit)):
        path = os.path.join(dir, lit[i])
        if os.path.isdir(path):
            files_.extend(get_all_files(path))
        if os.path.isfile(path):
            files_.append(path)
    return files_


result = {'time': [], 'lat': [], 'lon': []}
for band in progressbar.ProgressBar()(['red', 'green', 'blue', 'red_edge', 'nir']):
    image_path = r'E:P4M_image_progressingoriginal_imagezhanqian20210814classed'
    file_dir = get_all_files(os.path.join(image_path, band))
    result[band] = []
    if band == 'nir':
        for i in file_dir:
            xmp, exif = image_info(i)
            Camera_Irradiance = float(xmp['Xmp.Camera.Irradiance'])
            time = exif['Exif.Photo.DateTimeOriginal']
            lat = float(xmp['Xmp.drone-dji.GpsLatitude'])
            lon = float(xmp['Xmp.drone-dji.GpsLongtitude'])
            result['time'].append(time)
            result['lat'].append(lat)
            result['lon'].append(lon)
            result[band].append(Camera_Irradiance)
    else:
        for i in file_dir:
            xmp, exif = image_info(i)
            Camera_Irradiance = float(xmp['Xmp.Camera.Irradiance'])
            result[band].append(Camera_Irradiance)
df = pd.DataFrame(result)
绘制六个波段折线图
f['time'] = df['time'].apply(lambda x: pd.to_datetime(x, format='%Y:%m:%d %H:%M:%S'))
line_df = df[['time', 'blue', 'red_edge', 'green', 'red', 'nir']].set_index('time')
fig = plt.figure(figsize=(15, 15))
line_df.plot(lw=3)
plt.show()
结果如下
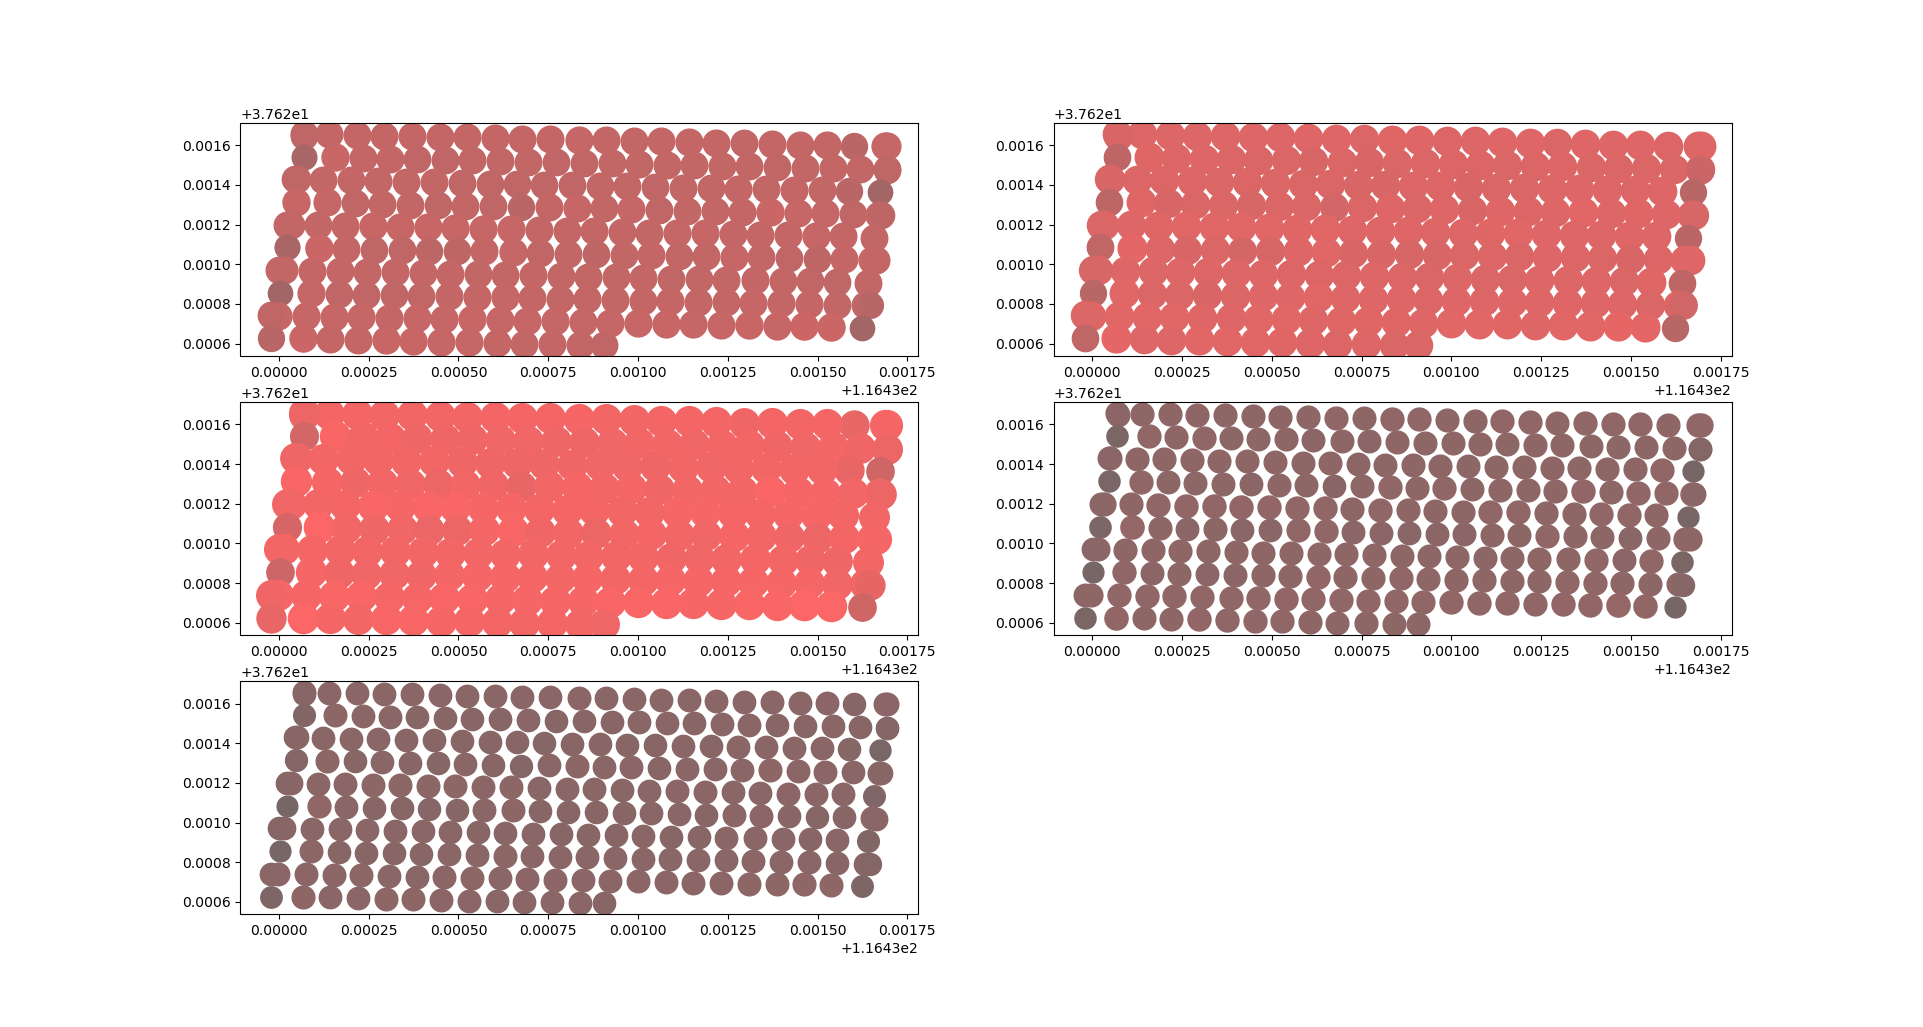
绘制坐标位置图
i = 1
for band in progressbar.ProgressBar()(['red', 'green', 'blue', 'red_edge', 'nir']):
    ax = fig2.add_subplot(3, 2, i)
    for j in range(len(df['lat'])):
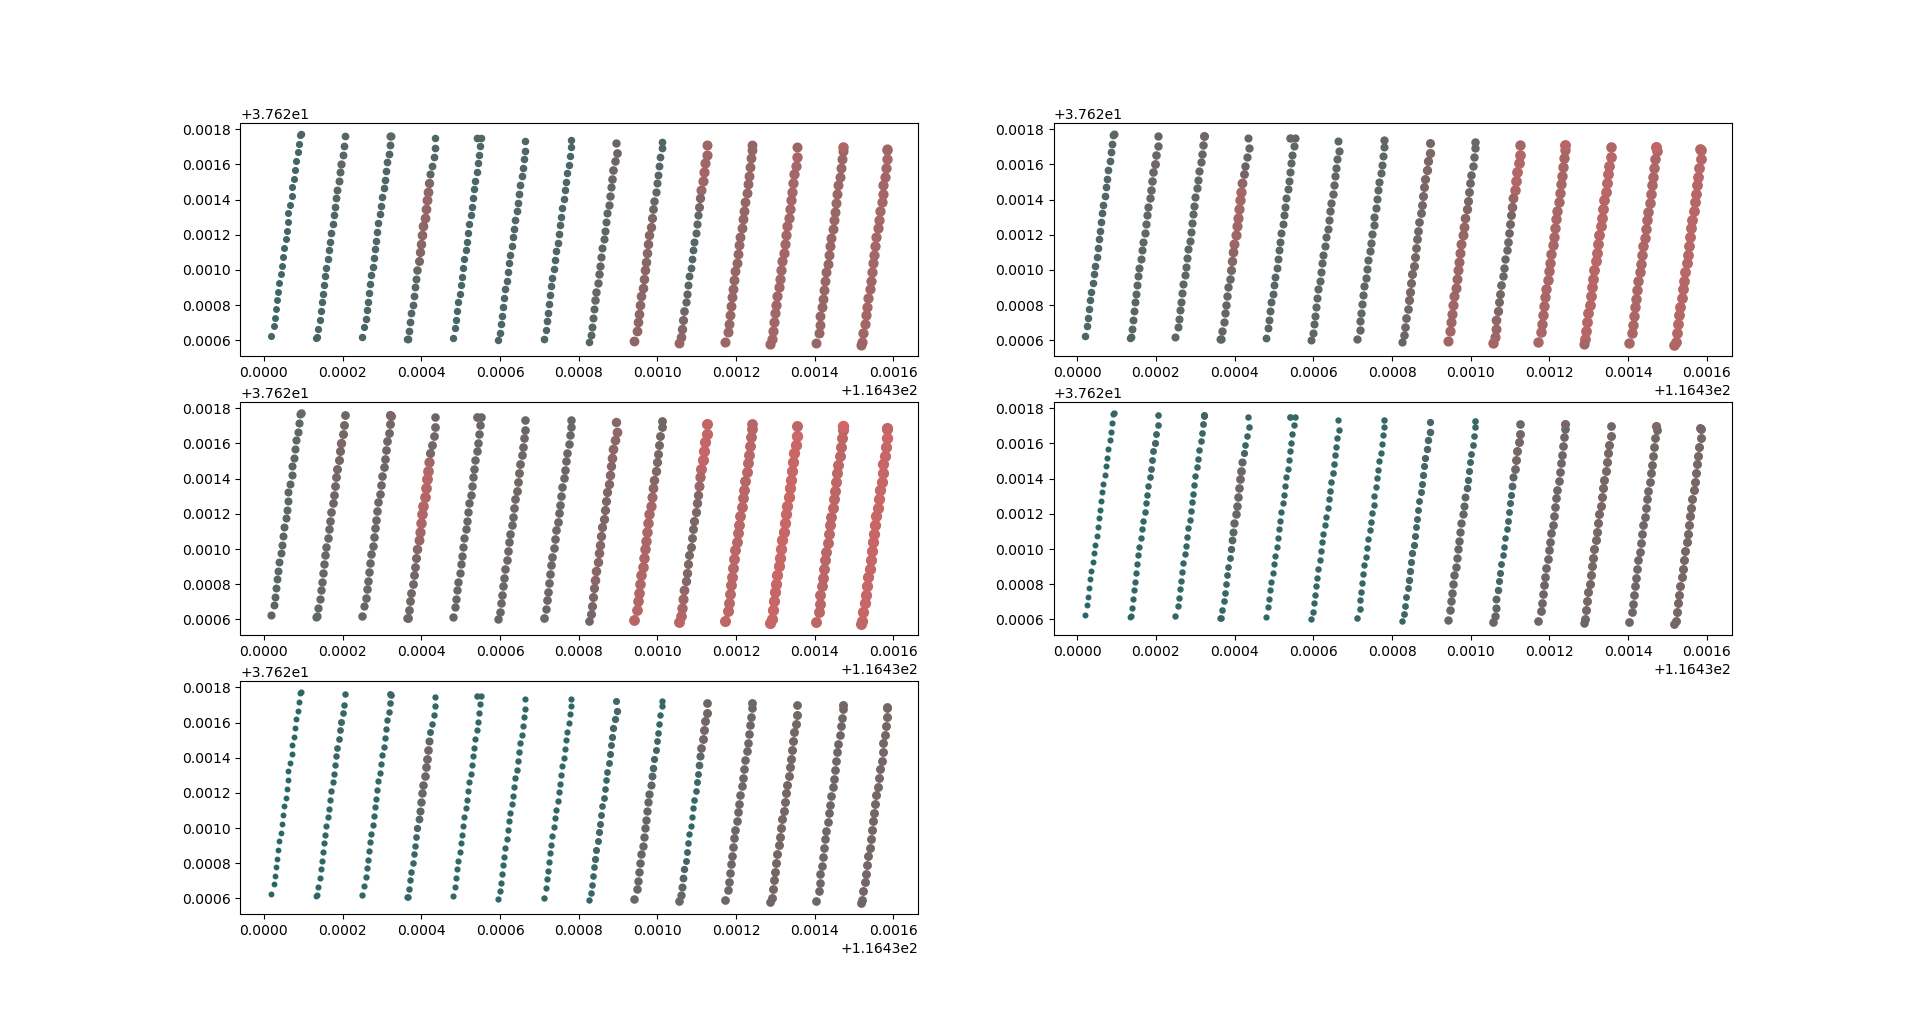
        color = '#%02x' % int(df[band][j] / 60) + '6666'  # 设置颜色随值大小变化
        ax.scatter(df['lon'][j], df['lat'][j], s=df[band][j] / 8, c=color, marker='.')
    i += 1
plt.show()
结果
总结
总体来看,第二张是在大晴天拍摄,效果还行,第一张是多云天拍摄,变化较大。飞机在转弯时光线变化也较大。
最后
以上就是哭泣皮卡丘最近收集整理的关于大疆精灵4多光谱辐射信息分析大疆多光谱简介波段分类实现代码总结的全部内容,更多相关大疆精灵4多光谱辐射信息分析大疆多光谱简介波段分类实现代码总结内容请搜索靠谱客的其他文章。
本图文内容来源于网友提供,作为学习参考使用,或来自网络收集整理,版权属于原作者所有。


![byte[] 转 file](https://www.shuijiaxian.com/files_image/reation/bcimg1.png)

发表评论 取消回复