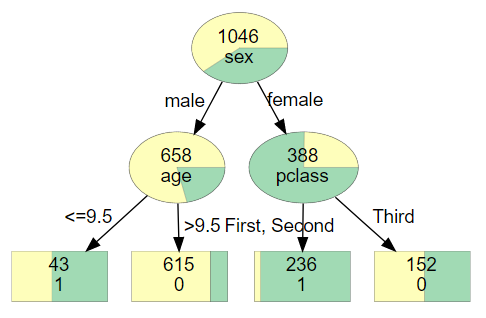
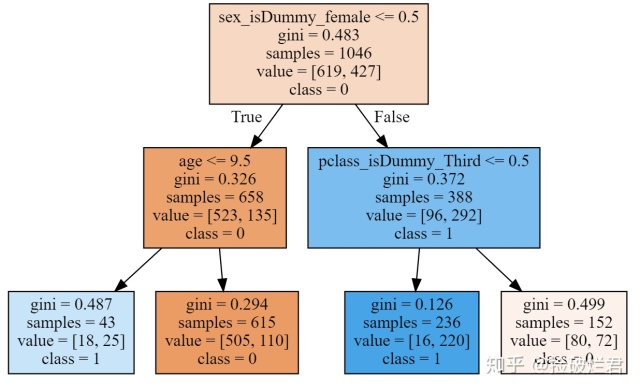
众所周知,scikit-learn作为Python中进行机器学习最常用最重要的一个库,它的CART可视化真的很糟糕(隔壁的R比它不知道高到哪里去了)。举个栗子,使用scikit-learn加上graphviz对泰坦尼克号存活数据进行可视化,你只能得到类似以下这个玩意,这对非数据科学领域的人非常极其的不友好。
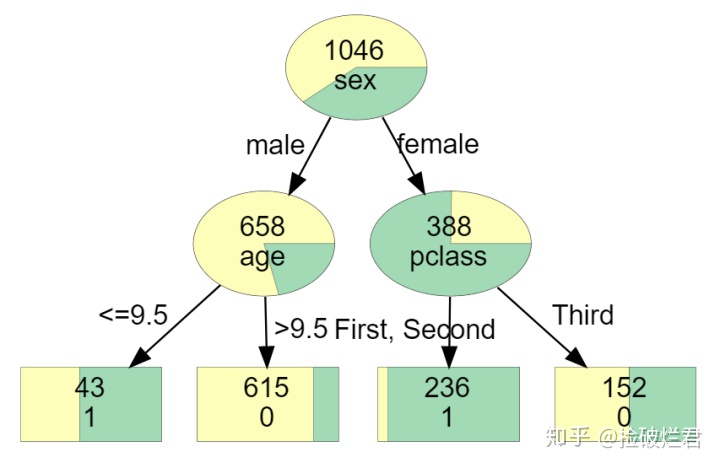
但是如果你用了如下的代码,那么你将得到这样一个一目了然的决策树!

那么这么神奇的图是怎么得到的呢?废话不多说,小二上酸菜!
一. 决策树绘制的规则
决策树又分为分类树和回归树,前者用于预测分类后者用于预测数值。在原有的复杂且冗长的树图上我们将做如下改进。
- 分类树
非叶节点上应有的信息:
- 是椭圆形
- 节点样本总数
- 用于判断的变量名称
- 各类组成结构饼状图
叶节点上应有信息:
- 是长方形
- 节点样本总数
- 类的名称
- 各类组成结构的柱状图
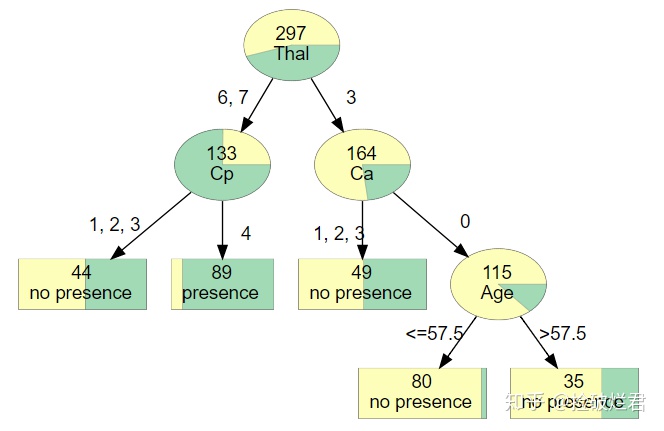
箭头上应有的信息:
- 如果判断变量为数值数据(Numerical Data),比如 age<= n:
- 左箭头上:<= n
- 右箭头上:> n
- 如果判断变量为分类数据(Categorical Data),
- 如果类别总数<= 5(比如 sex_isDummy_female <= 0.5):
- 左箭头上:male
- 右箭头上:female
- 如果类别总数量>5:
- 左箭头上:not female
- 右箭头上:female
- 如果类别总数<= 5(比如 sex_isDummy_female <= 0.5):
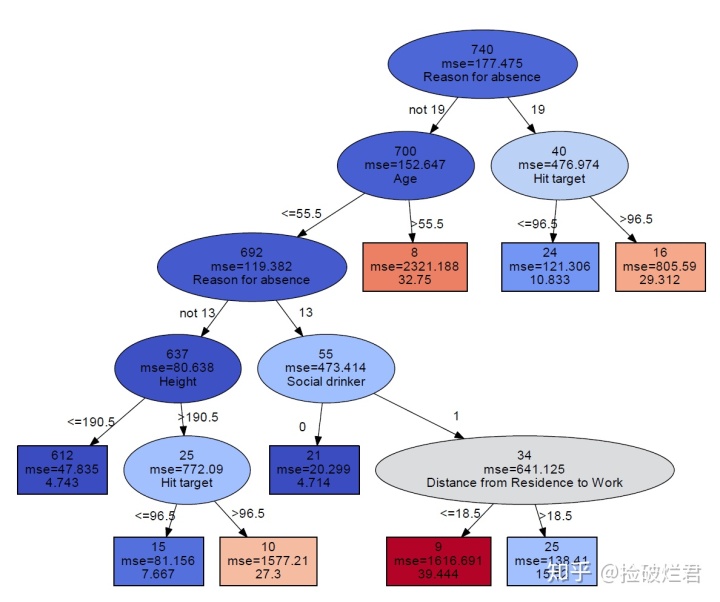
- 回归树
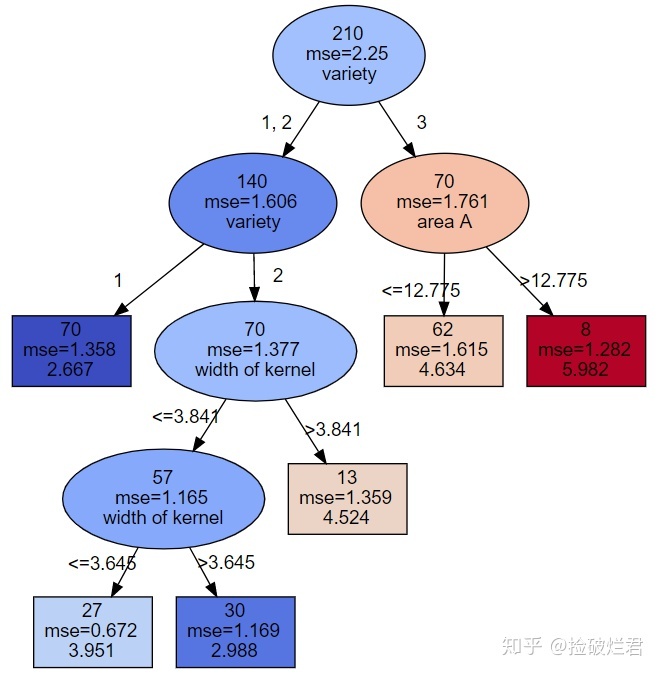
非叶节点上应有的信息:
- 是椭圆形
- 节点样本总数
- 误差值(Mean Square Error 或者 Mean Absolute Error)
- 用于判断的变量名称
- 数值颜色:颜色越冷(蓝)数值越小,颜色越热(红)数值越大
叶节点上应有信息:
- 是长方形
- 节点样品总数
- 预测的数值
- 数字颜色:颜色越冷(蓝)数值越小,颜色越热(红)数值越大
箭头上应有的信息(与分类树一样):
- 如果判断变量为数值数据(Numerical Data),比如 age<= n:
- 左箭头上:<= n
- 右箭头上:> n
- 如果判断变量为分类数据(Categorical Data),
- 如果类别总数<= 5(比如 sex_isDummy_female <= 0.5):
- 左箭头上:male
- 右箭头上:female
- 如果类别总数量>5:
- 左箭头上:not female
- 右箭头上:female
- 如果类别总数<= 5(比如 sex_isDummy_female <= 0.5):
二. 决策树可视化环境搭建
第一步上graphviz官方网站:http://www.graphviz.org/ 下载并安装graphviz
第二步给python安装graphviz库:pip install graphviz
第三步设置环境变量:
os.environ["PATH"] += os.pathsep + 'C:/Program Files (x86)/Graphviz2.38/bin/'
第四步:导入所有所需库
import 三. 先得到丑的那颗丑树
首先,我们先创建一个得到输入决策树所需所有参数的方程
输入:
- target: 所要预测目标变量的名字,是个字符串
- df: 表格
输出:
- yvec: 所要预测目标变量的序列
- xmat: 经过 dummy encoding 过后的表格
- vnames: 除去目标变量所有变量的名字
def get_yvec_xmat_vnames(target, df):

    yvec = df[target]

    # 将拥有n个不同数值的变量转换为n个0/1的变量,变量名字中有"_isDummy_"作为标注
    xmat = pd.get_dummies(df.loc[:, df.columns != target], prefix_sep = "_isDummy_")

    vnames = xmat.columns

    return yvec, xmat, vnames
导入数据,查看数据类型
(需要数据的在这里 链接: https://pan.baidu.com/s/1xPs4p2G8qIPIzqm2sP61Kg 提取码: f9nc)
df = pd.read_csv('Titanic.csv', header=0)
df.dtypes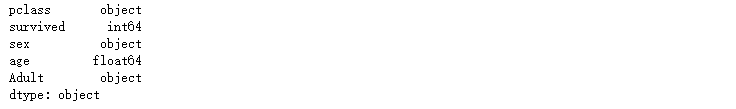
转换数据到应有的类型,这里survived值虽然为0或1,但不是数字类型
df.survived = df.survived.astype(str)构建决策树模型
yvec, xmat, vnames = get_yvec_xmat_vnames("survived",df)
dt = DecisionTreeClassifier(max_depth=2, random_state=1234)
dt.fit(xmat, yvec)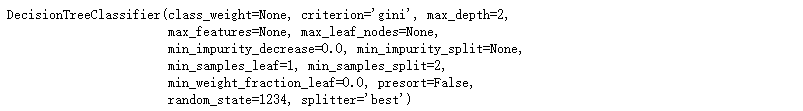
使用graphviz绘制决策树
dot_data = tree.export_graphviz(dt,
                       feature_names = vnames,
                      filled=True)
graph = graphviz.Source(dot_data)
graph 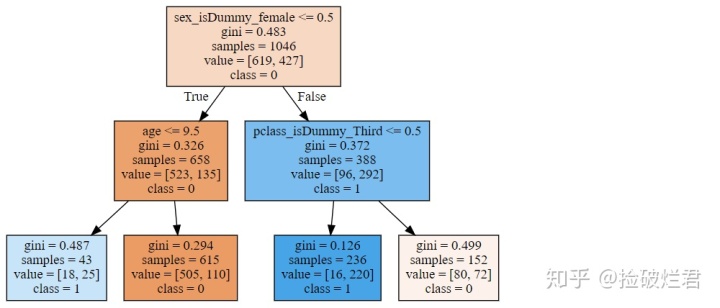
四. 再得到那颗优化过的树
首先我们需要一个储存所有名称及分类的字典
def get_categorical_dict(df):
    # store all the values of categorical value
    df_categorical = df.select_dtypes(include=['object', 'bool', 'category'])
    categorical_dict = {}
    for i in df_categorical.columns:
        # store in descending order
        categorical_dict[i]= sorted(list(set(df[i].astype('str'))))
    return categorical_dict
拿泰坦尼克号数据举例,我们得到:
get_categorical_dict(df)
然后我们构建一个新的绘制决策树的方程(不想看懂代码的直接复制粘贴就好)
def tree_to_dot(tree, target, df):
    """ 把树变成dot data,用于输入graphviz然后绘制

    参数
        tree: DecisionTree的输出
        target: 目标变量名字
        df: 表单

    输出
        graphvic_str: dot data
    """
    # get yvec, vnames and categorical_dict of the df
    yvec, xmat, vnames = get_yvec_xmat_vnames(target, df)
    categorical_dict = get_categorical_dict(df)

    if is_classifier(tree):
        # 如果是分类树
        # classes should be in descending order
        class_names = sorted(list(set(yvec)))
        return classification_tree_to_dot(tree, vnames, class_names, categorical_dict)
    else:
        return regression_tree_to_dot(tree, vnames, categorical_dict)


def classification_tree_to_dot(tree, feature_names, class_names, categorical_dict):
    """ 把分类树转化成dot data

    参数
        tree: DecisionTreeClassifier的输出
        feature_names: vnames, 除去目标变量所有变量的名字
        class_names: 目标变量所有的分类
        categorical_dict: 储存所有名称及分类的字典

    输出
        graphvic_str: the dot data
    """
    tree_ = tree.tree_

    # store colors that distinguish discrete chunks of data
    if len(class_names) <= 10:
        # get the colorblind friendly colors
        color_palette = adjust_colors(None)['classes'][len(class_names)]
    else:
        color_palette = sns.color_palette("coolwarm",len(class_names)).as_hex()

    feature_name = [
        feature_names[i] if i != _tree.TREE_UNDEFINED else "undefined!"
        for i in tree_.feature
    ]

    # initialize the dot data string
    graphvic_str = 'digraph Tree {node [shape=oval, penwidth=0.1, width=1, fontname=helvetica] ; edge [fontname=helvetica] ;'
    #print(graphvic_str)

    def recurse(node, depth, categorical_dict):
         # store the categorical_dict information of each side
        categorical_dict_L = categorical_dict.copy()
        categorical_dict_R = categorical_dict.copy()
        # non local statement of graphvic_str
        nonlocal graphvic_str
        # variable is not dummy by default
        is_dummy = False
        # get the threshold
        threshold = tree_.threshold[node]

        # get the feature name
        name = feature_name[node]
        # judge whether a feature is dummy or not by the indicator "_isDummy_"
        if "_isDummy_" in str(name) and name.split('_isDummy_')[0] in list(categorical_dict.keys()):
            is_dummy = True
            # if the feature is dummy, the threshold is the value following name
            name, threshold = name.split('_isDummy_')[0], name.split('_isDummy_')[1]

        # get the data distribution of current node
        value = tree_.value[node][0]
        # get the total amount
        n_samples = tree_.n_node_samples[node]
        # calculate the weight
        weights = [i/sum(value) for i in value]
        # get the largest class
        class_name = class_names[np.argmax(value)]

        # pair the color and weight
        fillcolor_str = ""
        for i, j in enumerate(color_palette):
            fillcolor_str += j + ";" + str(weights[i]) + ":"
        fillcolor_str = '"' + fillcolor_str[:-1] + '"'

        if tree_.feature[node] != _tree.TREE_UNDEFINED:
            # if the node is not a leaf
            graphvic_str += ('{} [style=wedged, label=<{}<br/>{}>, fillcolor ='+fillcolor_str+'] ;').format(node,n_samples,name)
            #print(('{} [style=wedged, label=<{}<br/>{}>, fillcolor ='+fillcolor_str+'] ;').format(node,n_samples,name))
            if is_dummy:
                # if the feature is dummy and if its total categories > 5
                categorical_dict_L[name] = [str(i) for i in categorical_dict_L[name] if i != threshold]
                categorical_dict_R[name] = [str(threshold)]
                if len(categorical_dict[name])>5:
                    # only show one category on edge
                    threshold_left = "not " + threshold
                    threshold_right = threshold
                else:
                    # if total categories <= 5, list all the categories on edge
                    threshold_left = ", ".join( categorical_dict_L[name])
                    threshold_right = threshold
            else:
                # if the feature is not dummy, then it is numerical
                threshold_left = "<="+ str(round(threshold,3))
                threshold_right = ">"+ str(round(threshold,3))
            graphvic_str += ('{} -> {} [labeldistance=2.5, labelangle=45, headlabel="{}"] ;').format(node,tree_.children_left[node],threshold_left)
            graphvic_str += ('{} -> {} [labeldistance=2.5, labelangle=-45, headlabel="{}"] ;').format(node,tree_.children_right[node],threshold_right)
            #print(('{} -> {} [labeldistance=2.5, labelangle=45, headlabel="{}"] ;').format(node,tree_.children_left[node],threshold_left))
            #print(('{} -> {} [labeldistance=2.5, labelangle=-45, headlabel="{}"] ;').format(node,tree_.children_right[node],threshold_right))

            recurse(tree_.children_left[node], depth + 1,categorical_dict_L)
            recurse(tree_.children_right[node], depth + 1,categorical_dict_R)
        else:
            # the node is a leaf
            graphvic_str += ('{} [shape=box, style=striped, label=<{}<br/>{}>, fillcolor ='+fillcolor_str+'] ;').format(node,n_samples,class_name)
            #print(('{} [shape=box, style=striped, label=<{}<br/>{}>, fillcolor ='+fillcolor_str+'] ;').format(node,n_samples,class_name))

    recurse(0, 1,categorical_dict)
    return graphvic_str + "}"

def regression_tree_to_dot(tree, feature_names, categorical_dict):
    """ 把回归树转换成dot data

    参数
        tree: DecisionTreeClassifier的输出
        feature_names: vnames, 除去目标变量所有变量的名字
        categorical_dict: 储存所有名称及分类的字典

    输出
        graphvic_str: the dot data
    """
    # get the criterion of regression tree: mse or mae
    criterion = tree.get_params()['criterion']

    tree_ = tree.tree_

    value_list = tree_.value[:,0][:,0]

    # Normalize data to produce heatmap colors
    cmap = cm.get_cmap('coolwarm')
    norm = Normalize(vmin=min(value_list), vmax=max(value_list))
    rgb_values = (cmap(norm(value_list))*255).astype(int)
    hex_values = ['#%02x%02x%02x' % (i[0], i[1], i[2]) for i in rgb_values]

    feature_name = [
        feature_names[i] if i != _tree.TREE_UNDEFINED else "undefined!"
        for i in tree_.feature
    ]

    # initialize the dot data string
    graphvic_str = 'digraph Tree {node [shape=oval, width=1, color="black", fontname=helvetica] ;edge [fontname=helvetica] ;'
    #print(graphvic_str)

    def recurse(node, depth, categorical_dict):
        # store the categorical_dict information of each side
        categorical_dict_L = categorical_dict.copy()
        categorical_dict_R = categorical_dict.copy()
        # non local statement of graphvic_str
        nonlocal graphvic_str

        # variable is not dummy by default
        is_dummy = False
        # get the threshold
        threshold = tree_.threshold[node]

        # get the feature name
        name = feature_name[node]
        # judge whether a feature is dummy or not by the indicator "_isDummy_"
        if "_isDummy_" in str(name) and name.split('_isDummy_')[0] in list(categorical_dict.keys()):
            is_dummy = True
            # if the feature is dummy, the threshold is the value following name
            name, threshold = name.split('_isDummy_')[0], name.split('_isDummy_')[1]

        # get the regression value
        value = round(tree_.value[node][0][0],3)
        # get the impurity
        impurity = criterion+ "=" + str(round(tree_.impurity[node],3))
        # get the total amount
        n_samples = tree_.n_node_samples[node]


        # pair the color with node
        fillcolor_str = '"'+hex_values[node]+'"'

        if tree_.feature[node] != _tree.TREE_UNDEFINED:
            # if the node is not a leaf
            graphvic_str += ('{} [style="filled", label=<{}<br/>{}<br/>{}>, fillcolor ='+fillcolor_str+'] ;').format(node,n_samples,impurity,name)
            #print(('{} [style="filled", label=<{}<br/>{}<br/>{}>, fillcolor ='+fillcolor_str+'] ;').format(node,n_samples,impurity,name))
            if is_dummy:
                # if the feature is dummy and if its total categories > 5
                categorical_dict_L[name] = [str(i) for i in categorical_dict_L[name] if i != threshold]
                categorical_dict_R[name] = [str(threshold)]

                if len(categorical_dict[name])>5:
                    # only show one category on edge
                    threshold_left = "not " + threshold
                    threshold_right = threshold
                else:
                    # if total categories <= 5, list all the categories on edge
                    threshold_left = ", ".join(categorical_dict_L[name])
                    threshold_right = threshold
            else:
                # if the feature is not dummy, then it is numerical
                threshold_left = "<="+ str(round(threshold,3))
                threshold_right = ">"+ str(round(threshold,3))
            graphvic_str += ('{} -> {} [labeldistance=2.5, labelangle=45, headlabel="{}"] ;').format(node,tree_.children_left[node],threshold_left)
            graphvic_str += ('{} -> {} [labeldistance=2.5, labelangle=-45, headlabel="{}"] ;').format(node,tree_.children_right[node],threshold_right)
            #print(('{} -> {} [labeldistance=2.5, labelangle=45, headlabel="{}"] ;').format(node,tree_.children_left[node],threshold_left))
            #print(('{} -> {} [labeldistance=2.5, labelangle=-45, headlabel="{}"] ;').format(node,tree_.children_right[node],threshold_right))

            recurse(tree_.children_left[node], depth + 1,categorical_dict_L)
            recurse(tree_.children_right[node], depth + 1,categorical_dict_R)
        else:
            # the node is a leaf
            graphvic_str += ('{} [shape=box, style=filled, label=<{}<br/>{}<br/>{}>, fillcolor ='+fillcolor_str+'] ;').format(node,n_samples,impurity,value)
            #print(('{} [shape=box, style=filled, label=<{}<br/>{}<br/>{}>, fillcolor ='+fillcolor_str+'] ;').format(node,n_samples,impurity,value))

    recurse(0, 1,categorical_dict)
    return graphvic_str + "}"
想要知道方程和 dot data 如何工作的可以将方程中的 print 行全部解除注释,然后逐行查看。至于里面的英文注释待我慢慢换成中文。。。
接下来运行 tree_to_dot 然后把生成的 dot data 放入graphviz中
dot_data = tree_to_dot(dt, "survived",df)
graph = graphviz.Source(dot_data)
graph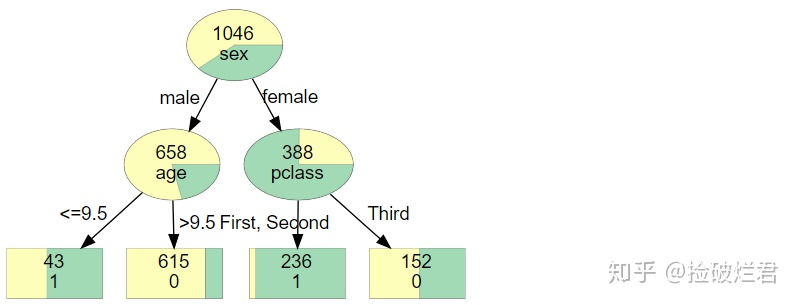
好看的树就诞生啦!
五. 一些栗子
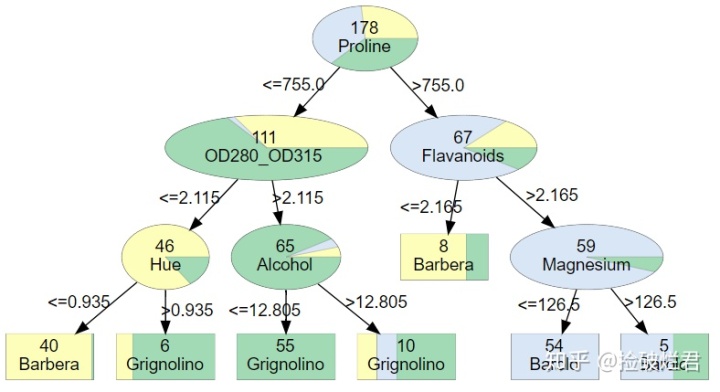
不要光收藏不点赞哦
最后
以上就是苹果灰狼最近收集整理的关于graphviz python_Python | 基于scikit-learn决策树可视化优化的全部内容,更多相关graphviz内容请搜索靠谱客的其他文章。


![[开发环境]graphviz环境安装](https://www.shuijiaxian.com/files_image/reation/bcimg9.png)
发表评论 取消回复