文章目录
- 导读
- 前期准备
- 优先确认界面(概要设计)
- 确认复用关系(详细设计)
- 开始编码
- 不怎么需要注意的注意事项
- 绝对要注意的注意事项
- 获取屏幕分辨率时很细节的一个片段
- 结构概述
- 基础配置类
- 最初的父类
- 主界面
- 消息窗体
- 算法部分
- 美化
- 整合
导读
既然我们之前从用Qt学着做个界面中学到了最基本的GUI搭建方法,那就让我们结合研究生的数据分析日常,让我们来看看一个简单的数据分析界面应该怎么做。主要的分析步骤是根据数据酷客的案例的基础上加以改编,在这里这位佚名作者表示感谢。
前期准备
这里我还是和之前的用Qt学着做个界面一样的准备:
Ubuntu20.04 20.04 20.04Python3.8.5 3.8.5 3.8.5Microsoft Visual Studio Code1.52.1 1.52.1 1.52.1Microsoft官方提供的适用于Microsoft Visual Studio Code的Python拓展包(名字就是Python)
数据还是使用的德国能源数据,和之前的开工:数据集的特征理解一样。
优先确认界面(概要设计)
由于这个界面是一个小项目,所以我们得有些规划。
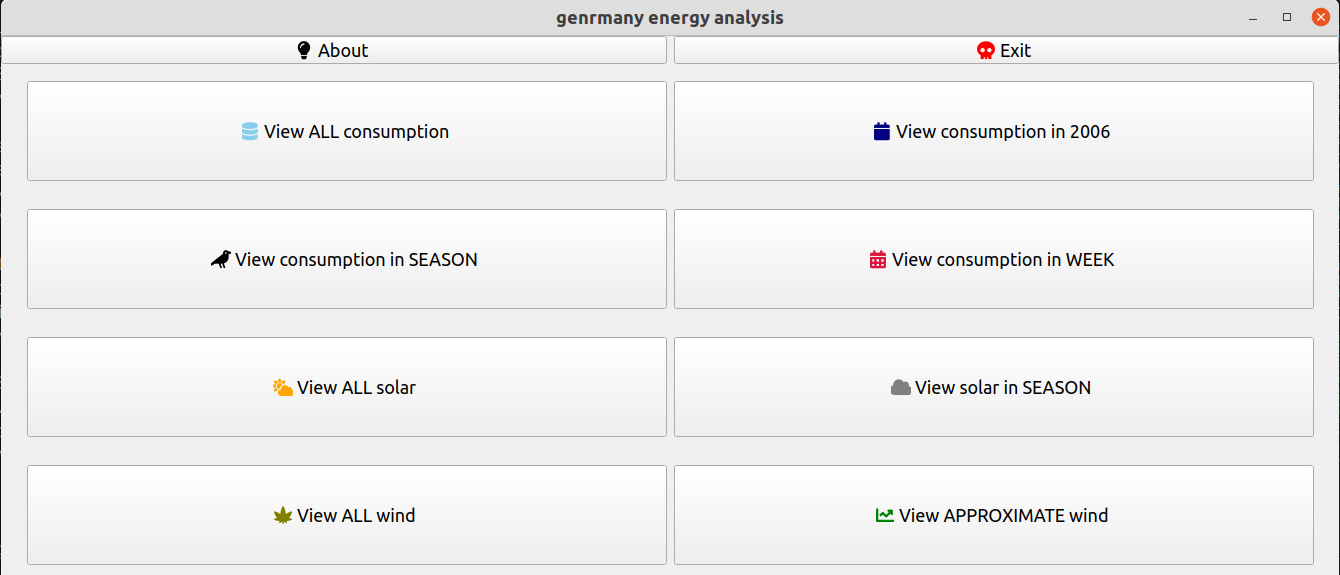
首先确认一个大致的界面规划:

首先,一个很普通的关于按钮和退出按钮在上面。
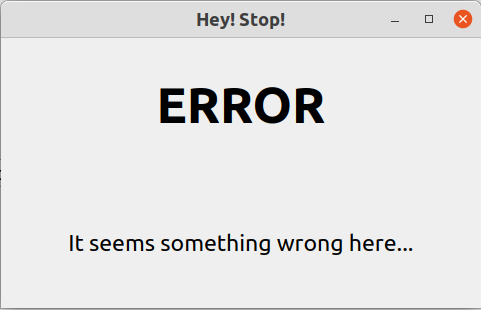
退出按钮就是单纯的结束程序,而关于按钮则是弹窗说明作者(我)的一点点信息。
就像这样:

虽然这张图完全不像是在介绍信息,但大致上也是这个样子。
在下面就是有关能耗、太阳能发电量、风力发电量、综合发电量的所有数据、年度数据、季度数据和周度数据,最后再来个预测,看看多少年后混合发电量能够满足能耗均值。
这些按钮点开都能显示一张数据可视化表,在预测部分还会有个弹窗说明预测结果。
当然,这个图只是示意图,并不代表最终成果。我们还可以稍加修改。
确认复用关系(详细设计)
首先,我们需要确定,窗体可以使用QWidget创建,只不过我们为了加一些属性就继承了这个类进行复写。所以,我们会定义一个有很多基础属性的自定义窗体,并把一些基础字段封装在构造函数中。
有了基础父类,接下来就是主界面了。主界面作为独立的一个界面,继承了基础父类之后不会再往下继承。
其次,还有弹窗。这个弹窗同样也得继承自基础父类,但是和主界面有所不同。对于关于按钮的弹窗和预测图表的弹窗可以使用相同的样式,也就是上面我们显示的Error样式。弹窗中可以使用一个大标题、一个小标题,这两个字段都可以封装在构造函数中。
之后便是绘图了。为了让这个小项目看起来没有那么复杂,我们就使用matplotlib库好了。
开始编码
既然已经明白该怎么做了,就直接开始吧。
不怎么需要注意的注意事项
当然,如果项目的体量再大些的话,没有详细的文档还是不建议开始。
绝对要注意的注意事项
获取屏幕分辨率时很细节的一个片段
我们在很多博客中看到使用QApplication.desktop()这个方法来获取屏幕分辨率的方法,用的时候用就行了,这倒没什么问题。但是这种方法不是随便什么情况都能用的。
因为QApplication这个类在创建主线程的同时,也对很多神奇对象进行了初始化,包括desktop对象,用于对你电脑屏幕分辨率的读取;还有clipbroad对象,用于对你的剪切板的读写等等。
所以,在将屏幕分辨率单独用一个静态类(包括enumerate类和普通类中的静态变量)封装的时候,Python解释器会在处理这些静态类的时候突然发现必要的desktop对象没有实例化,就抛出异常甩手不干了。如果是用普通类封装成普通成员变量的话会避开这个问题,但是在使用的时候还需要额外创建一个实体类,在一些时候还会被GC处理掉,不如静态类方便。
所以,这里我推荐使用enumerate类封装这些数据,同时将app = QApplication(sys.args)也同样放在这个enumerate类中。
结构概述
先来看看如何构造我们需要的这些类:
首先,是最初的父类窗体;父类窗体通过继承得到了两个子类,一个主窗体,一个弹窗;主窗体内组合了两种弹窗,一种信息弹窗,一种错误弹窗;主窗体内还组合了一个算法模块。
大概就是:
(这个)ClassDiagram类图编辑器也太好用了吧
基础配置类
就像刚刚说的,我们需要在一开始就创建主线程,让PyQt自己创建的同时也初始化一些必要的对象。代码如下:
# 静态枚举类
class CONFIG(enumerate):
  # 主线程创建
  app = QApplication(sys.argv)
  # 屏幕宽高,用于限制窗体最大宽高
  SCREEN_WIDTH = QApplication.desktop().width()
  SCREEN_HEIGHT = QApplication.desktop().height()
  # 窗体默认宽高
  WINDOW_HEIGHT = int(SCREEN_HEIGHT / 2)
  WINDOW_WIDTH = int(SCREEN_WIDTH / 2)
  # 窗体默认位置
  WINDOW_X = int(SCREEN_WIDTH / 4)
  WINDOW_Y = int(SCREEN_HEIGHT / 4)
  # 弹窗默认宽高
  BOX_WIDTH = int(WINDOW_WIDTH / 2)
  BOX_HEIGHT = int(WINDOW_HEIGHT / 2)
  # 弹窗默认位置
  BOX_X = int(SCREEN_WIDTH * 3 / 8)
  BOX_Y = int(SCREEN_HEIGHT * 3 / 8)
  pass
最初的父类
最初的父类我们还是一次性把所有的方法全部给出来,并且全都给空方法。子类需要就继承并重写,不需要留着不用也没事。所以就是这样:
class QWindow(QWidget):
  def __init__(self, title, icon, width, height, x, y, parent=None, flags=Qt.WindowFlags()):
    super().__init__(parent=parent, flags=flags)
    pass

  def init_layout(self, title, icon):
    pass

  def init_widget(self):
    pass

  def finish_layout(self):
    pass

  def set_events(self):
    pass

  pass
主界面
在这里主界面并不是一次性给出的,而是一点一点补全的。在后面介绍其他类的时候还会逐步完善,这里只给出到目前为止能够写出来的:
# 主窗体
class QAnalyzeUI(QWindow):
  # 构造函数
  # title - 窗体标题
  # icon - 窗体图标
  # width,height, x, y - 窗体尺寸和位置
  def __init__(self, title, icon, width=CONFIG.WINDOW_WIDTH, height=CONFIG.WINDOW_HEIGHT, x=CONFIG.WINDOW_X, y=CONFIG.WINDOW_Y, parent=None, flags=Qt.WindowFlags()):
    super().__init__(title, icon, width, height, x, y, parent=parent, flags=flags)
    # 表格布局
    self.grid_layout = QGridLayout()
    self.grid_layout.setContentsMargins(0, 0, 0, 0)
    # 设置控件
    self.init_layout(title, icon)
    self.init_widget()
    self.finish_layout()
    # 设置控件对应的事件 - 由于其他成员为定义,所以下面只给出部分事件
    self.set_events()
    # 其实还有部分成员,但是由于成员未定义,暂时不给出。后面介绍到了再说明
    pass
  # 初始化布局,包括尺寸和位置以及标题和图标
  def init_layout(self, title, icon):
    super().init_layout(title, icon)
    self.resize(CONFIG.WINDOW_WIDTH, CONFIG.WINDOW_HEIGHT)
    self.move(CONFIG.WINDOW_X, CONFIG.WINDOW_Y)
    self.setWindowTitle(title)
    self.setWindowIcon(icon)
    pass
  # 初始化控件 - 仅包含控件类别和控件位置,控件事件绑定在其他方法中
  def init_widget(self):
    super().init_widget()
    # 关于按钮
    self.about_btn = QPushButton(qta.icon('fa5s.lightbulb', color = 'black'), 'About')
    self.grid_layout.addWidget(self.about_btn, 0, 0, 1, 5)
    # 退出按钮
    self.exit_btn = QPushButton(qta.icon('fa5s.skull', color = 'red'), 'Exit')
    self.grid_layout.addWidget(self.exit_btn, 0, 6, 1, 5)
    # 显示所有数据的图表按钮
    self.all_data_btn = QPushButton(qta.icon('fa5s.database', color = 'skyblue'), 'View ALL consumption')
    self.grid_layout.addWidget(self.all_data_btn, 1, 1, 2, 3)
    # 按年显示的图表按钮
    self.year_data_btn = QPushButton(qta.icon('fa5s.calendar', color = 'navy'), 'View consumption in 2006')
    self.grid_layout.addWidget(self.year_data_btn, 1, 7, 2, 3)
    # 按季节显示的图表按钮
    self.season_data_btn = QPushButton(qta.icon('fa5s.crow', color = 'black'), 'View consumption in SEASON')
    self.grid_layout.addWidget(self.season_data_btn, 3, 1, 2, 3)
    # 按周显示的图表按钮
    self.week_data_btn = QPushButton(qta.icon('fa5s.calendar-alt', color = 'crimson'), 'View consumption in WEEK')
    self.grid_layout.addWidget(self.week_data_btn, 3, 7, 2, 3)
    # 所有太阳能发电的图表按钮
    self.all_solar_btn = QPushButton(qta.icon('fa5s.cloud-sun', color = 'orange'), 'View ALL solar')
    self.grid_layout.addWidget(self.all_solar_btn, 5, 1, 2, 3)
    # 按季节显示的太阳能发电的图表按钮
    self.season_solar_btn = QPushButton(qta.icon('fa5s.cloud', color = 'grey'), 'View solar in SEASON')
    self.grid_layout.addWidget(self.season_solar_btn, 5, 7, 2, 3)
    # 显示所有风力发电的图表按钮
    self.all_wind_btn = QPushButton(qta.icon('fa5s.cannabis', color = 'olive'), 'View ALL wind')
    self.grid_layout.addWidget(self.all_wind_btn, 7, 1, 2, 3)
    # 大致预测发电按钮
    self.appro_wind_btn = QPushButton(qta.icon('fa5s.chart-line', color = 'green'), 'View APPROXIMATE wind')
    self.grid_layout.addWidget(self.appro_wind_btn, 7, 7, 2, 3)
    pass
  # 结束布局设置
  def finish_layout(self):
    super().finish_layout()
    self.setLayout(self.grid_layout)
    pass
  # 设置事件
  def set_events(self):
    super().set_events()
    self.exit_btn.clicked.connect(lambda: self.close())
    pass

  pass
到了这一步肯定会有人想测试一下到底是什么结果,所以我把主函数也放出来:
if __name__ == '__main__':
  # 创建窗体
  ui = QAnalyzeUI('germany energy', qta.icon('fa5s.broadcast-tower', color='red'), CONFIG.WINDOW_WIDTH, CONFIG.WINDOW_HEIGHT, CONFIG.WINDOW_X, CONFIG.WINDOW_Y)
  # 显示窗体
  ui.show()
  # 限制程序只能在主线程退出后结束
  # 这里的CONFIG.app就是一开始配置类里为了获取屏幕分辨率的app,是个变量
  sys.exit(CONFIG.app.exec())
  pass
消息窗体
消息窗体虽然继承自最初的父类,但是还需要衍生出信息弹窗、错误弹窗和预测弹窗。在这里如果继续给出空方法让子类继承的话就太冗赘了。由于不同的弹窗之间差异很小,基本上只有文字的差别,所以这里我们就直接使用一个属性代表不同的弹窗,这样的话信息弹窗、错误弹窗和预测弹窗都只需要用同一个构造函数,就方便很多了。
class Box(QWindow):
  # 构造函数
  # title - 窗体标题
  # icon - 窗体图标
  # width, height, x, y - 窗体尺寸和位置
  # type - 窗体类别 - 确定大标题
  # text - 窗体提示 - 确定详情
  def __init__(self, title, icon, width, height, x, y, type, text, parent=None, flags=Qt.WindowFlags()):
    super().__init__(title, icon, width, height, x, y, parent=parent, flags=flags)
    # 一样的,设置布局、设置控件、结束布局设置
    self.grid_layout = QGridLayout()
    self.grid_layout.setContentsMargins(0, 0, 0, 0)
    self.init_layout(title, icon)
    self.init_widget(type, text)
    self.finish_layout()
    pass
  # 确定默认尺寸和位置,顺便给定大标题
  def init_layout(self, title, icon):
    super().init_layout(title, icon)
    self.resize(CONFIG.BOX_WIDTH, CONFIG.BOX_HEIGHT)
    self.move(CONFIG.BOX_X, CONFIG.BOX_Y)
    self.setWindowTitle(title)
    self.setWindowIcon(icon)
    pass
  # 设置控件
  def init_widget(self, type, text):
    super().init_widget()
    self.icon_label = QLabel()
    # 根据窗体类别确定大标题
    if type == 1:
      self.icon_label.setText('Prediction')
    elif type == 2:
      self.icon_label.setText('ERROR')
    else:
      self.icon_label.setText('About')
      pass
    # 大标题样式和字体
    self.icon_label.setFont(QFont('Ubuntu', 30, QFont.Bold))
    self.icon_label.setAlignment(Qt.AlignCenter)
    # 详情内容、样式和字体
    self.message = QLabel()
    self.message.setText(text)
    self.message.setFont(QFont('Ubuntu', 14))
    self.message.setAlignment(Qt.AlignCenter)
    self.message.setWordWrap(True)
    # 放入布局
    self.grid_layout.addWidget(self.icon_label, 0, 0, 1, 3)
    self.grid_layout.addWidget(self.message, 1, 0, 1, 3)
    pass
  # 结束布局设置
  def finish_layout(self):
    super().finish_layout()
    self.setLayout(self.grid_layout)
    pass

  pass
算法部分
考虑到我们的数据中只有四个不同的属性,而且最终分析的时候只是分析综合发电量随着时间变化的增长关系,也就是风力发电量和太阳能发电量的总和随着时间变化的曲线方程。所以,我们就使用sklearn中的线性回归模块来做。
# 数据集处理与分析的库
import pandas as pd
# 真正的算法处理主要用这个库
from sklearn.linear_model import LinearRegression

class AnalyzeAlg(object):
  def __init__(self):
    super().__init__()
    # 读取数据,数据集请回到文章最前面几段里面找链接
    self.all_data = pd.read_csv('/home/sakebow/python/data/germany_energy.csv')
    # 确认索引,并且替换掉原先的索引
    self.all_data.set_index('Date', inplace=True)
    # 设置新的索引后,日期还是字符串,需要转换为日期格式
    self.date_index = pd.to_datetime(self.all_data.index)
    # 将月份与季度对应起来,并作为新列加入数据集中
    # range(m, n) - 取m到n-1之间的所有自然数,并合成数组
    # zip(array1, array2) - 将array1和array2两个数组按照索引序号一一对应起来打包成元组
    # dict(m, n) - 将m设置为键,n设置为值,两个组成键值对的形式
    # map - 针对新给的数组,根据range、zip、dict三个所共同确定的键值对一一对应映射
    self.all_data['Season'] = self.date_index.month.map(dict(zip(range(1, 13), [1,1,2,2,2,3,3,3,4,4,4,1])))
    pass
  pass
美化
由于美化并不是这个项目的重点,所以就不美化了。各位小伙伴可以按照用Qt学着做个界面中给出的QSS美化案例一点点尝试。
整合
好了,到这一步基本上所有的内容都大致确定了,最后我们就根据最开始的类图来整合吧。
下面我将给出全部代码。如果你觉得复制太麻烦,也可以看看我的GitHub,直接把整个文件下载下来。
(下面都是代码了,没别的了)
# -*- coding: utf-8 -*-

import sys
from PyQt5.QtGui import QFont
import qtawesome as qta
from matplotlib import pyplot
import numpy as np
import pandas as pd

from sklearn.linear_model import LinearRegression
from PyQt5.Qt import Qt, QWidget, QGridLayout, QApplication, QPushButton, QLabel

class CONFIG(enumerate):
  app = QApplication(sys.argv)
  SCREEN_WIDTH = QApplication.desktop().width()
  SCREEN_HEIGHT = QApplication.desktop().height()

  WINDOW_HEIGHT = int(SCREEN_HEIGHT / 2)
  WINDOW_WIDTH = int(SCREEN_WIDTH / 2)

  WINDOW_X = int(SCREEN_WIDTH / 4)
  WINDOW_Y = int(SCREEN_HEIGHT / 4)

  BOX_WIDTH = int(WINDOW_WIDTH / 2)
  BOX_HEIGHT = int(WINDOW_HEIGHT / 2)

  BOX_X = int(SCREEN_WIDTH *3 / 8)
  BOX_Y = int(SCREEN_HEIGHT * 3 / 8)
  pass

class QWindow(QWidget):
  def __init__(self, title, icon, width, height, x, y, parent=None, flags=Qt.WindowFlags()):
    super().__init__(parent=parent, flags=flags)
    pass

  def init_layout(self, title, icon):
    pass

  def init_widget(self):
    pass

  def finish_layout(self):
    pass

  def set_events(self):
    pass

  pass

class QAnalyzeUI(QWindow):
  def __init__(self, title, icon, width=CONFIG.WINDOW_WIDTH, height=CONFIG.WINDOW_HEIGHT, x=CONFIG.WINDOW_X, y=CONFIG.WINDOW_Y, parent=None, flags=Qt.WindowFlags()):
    super().__init__(title, icon, width, height, x, y, parent=parent, flags=flags)
    self.grid_layout = QGridLayout()
    self.grid_layout.setContentsMargins(0, 0, 0, 0)
    self.init_layout(title, icon)
    self.init_widget()
    self.finish_layout()
    self.set_events()
    self.about_box = Box(title = 'About', icon = qta.icon('fa5s.broadcast-tower', color='red'), width = CONFIG.BOX_WIDTH, height= CONFIG.BOX_HEIGHT, x= CONFIG.BOX_X, y= CONFIG.BOX_Y, type=0, text = 'Here goes something you must attention before it's too late')
    self.predict_box = Box(title= 'Prediction', icon= qta.icon('fa5s.broadcast-tower', color= 'red'), width= CONFIG.BOX_WIDTH, height= CONFIG.BOX_HEIGHT, x= CONFIG.BOX_X, y= CONFIG.BOX_Y, type=1, text= '')
    self.alg = AnalyzeAlg()
    pass

  def init_layout(self, title, icon):
    super().init_layout(title, icon)
    self.resize(CONFIG.WINDOW_WIDTH, CONFIG.WINDOW_HEIGHT)
    self.move(CONFIG.WINDOW_X, CONFIG.WINDOW_Y)
    self.setWindowTitle(title)
    self.setWindowIcon(icon)
    pass

  def init_widget(self):
    super().init_widget()
    self.about_btn = QPushButton(qta.icon('fa5s.lightbulb', color = 'black'), 'About')
    self.grid_layout.addWidget(self.about_btn, 0, 0, 1, 5)

    self.exit_btn = QPushButton(qta.icon('fa5s.skull', color = 'red'), 'Exit')
    self.grid_layout.addWidget(self.exit_btn, 0, 6, 1, 5)

    self.all_data_btn = QPushButton(qta.icon('fa5s.database', color = 'skyblue'), 'View ALL consumption')
    self.grid_layout.addWidget(self.all_data_btn, 1, 1, 2, 3)

    self.year_data_btn = QPushButton(qta.icon('fa5s.calendar', color = 'navy'), 'View consumption in 2006')
    self.grid_layout.addWidget(self.year_data_btn, 1, 7, 2, 3)

    self.season_data_btn = QPushButton(qta.icon('fa5s.crow', color = 'black'), 'View consumption in SEASON')
    self.grid_layout.addWidget(self.season_data_btn, 3, 1, 2, 3)

    self.week_data_btn = QPushButton(qta.icon('fa5s.calendar-alt', color = 'crimson'), 'View consumption in WEEK')
    self.grid_layout.addWidget(self.week_data_btn, 3, 7, 2, 3)

    self.all_solar_btn = QPushButton(qta.icon('fa5s.cloud-sun', color = 'orange'), 'View ALL solar')
    self.grid_layout.addWidget(self.all_solar_btn, 5, 1, 2, 3)

    self.season_solar_btn = QPushButton(qta.icon('fa5s.cloud', color = 'grey'), 'View solar in SEASON')
    self.grid_layout.addWidget(self.season_solar_btn, 5, 7, 2, 3)

    self.all_wind_btn = QPushButton(qta.icon('fa5s.cannabis', color = 'olive'), 'View ALL wind')
    self.grid_layout.addWidget(self.all_wind_btn, 7, 1, 2, 3)

    self.appro_wind_btn = QPushButton(qta.icon('fa5s.chart-line', color = 'green'), 'View APPROXIMATE wind')
    self.grid_layout.addWidget(self.appro_wind_btn, 7, 7, 2, 3)
    pass

  def finish_layout(self):
    super().finish_layout()
    self.setLayout(self.grid_layout)
    pass

  def set_events(self):
    super().set_events()
    self.about_btn.clicked.connect(lambda: self.about())
    self.exit_btn.clicked.connect(lambda: self.close())
    self.all_data_btn.clicked.connect(lambda: self.alg.show_all_data())
    self.year_data_btn.clicked.connect(lambda: self.alg.show_data_in_2006())
    self.season_data_btn.clicked.connect(lambda: self.alg.show_data_in_season('Consumption'))
    self.week_data_btn.clicked.connect(lambda: self.alg.show_data_in_week())
    self.all_solar_btn.clicked.connect(lambda: self.alg.show_all_data_for_field('Solar'))
    self.season_solar_btn.clicked.connect(lambda: self.alg.show_data_in_season('Solar'))
    self.all_wind_btn.clicked.connect(lambda: self.alg.show_all_data_for_field('Wind'))
    self.appro_wind_btn.clicked.connect(lambda: self.predict_info_function())
    pass

  def about(self):
    self.about_box.message.setText('Author: sakebownApplication: Energy Analysis')
    self.about_box.show()
    pass

  def predict_info_function(self):
    self.alg.predict_wind()
    k, b = self.alg.predict_model()
    days = int((self.alg.all_consumption_data.mean() - b) / k)
    self.predict_box.icon_label.setText('Prediction')
    self.predict_box.message.setText(f'The Wind & Solar will replace coal in {self.alg.days2date(days)[0]}-{self.alg.days2date(days)[1]}-{self.alg.days2date(days)[2]}')
    self.predict_box.show()
    pass

  pass

class Box(QWindow):
  def __init__(self, title, icon, width, height, x, y, type, text, parent=None, flags=Qt.WindowFlags()):
    super().__init__(title, icon, width, height, x, y, parent=parent, flags=flags)
    self.grid_layout = QGridLayout()
    self.grid_layout.setContentsMargins(0, 0, 0, 0)
    self.init_layout(title, icon)
    self.init_widget(type, text)
    self.finish_layout()
    pass

  def init_layout(self, title, icon):
    super().init_layout(title, icon)
    self.resize(CONFIG.BOX_WIDTH, CONFIG.BOX_HEIGHT)
    self.move(CONFIG.BOX_X, CONFIG.BOX_Y)
    self.setWindowTitle(title)
    self.setWindowIcon(icon)
    pass

  def init_widget(self, type, text):
    super().init_widget()
    self.icon_label = QLabel()
    if type == 1:
      self.icon_label.setText('Prediction')
    elif type == 2:
      self.icon_label.setText('ERROR')
    else:
      self.icon_label.setText('About')
      pass
    self.icon_label.setFont(QFont('Ubuntu', 30, QFont.Bold))
    self.icon_label.setAlignment(Qt.AlignCenter)

    self.message = QLabel()
    self.message.setText(text)
    self.message.setFont(QFont('Ubuntu', 14))
    self.message.setAlignment(Qt.AlignCenter)
    self.message.setWordWrap(True)
    self.grid_layout.addWidget(self.icon_label, 0, 0, 1, 3)
    self.grid_layout.addWidget(self.message, 1, 0, 1, 3)
    pass

  def finish_layout(self):
    super().finish_layout()
    self.setLayout(self.grid_layout)
    pass

  pass

class AnalyzeAlg(object):
  def __init__(self):
    super().__init__()
    self.all_data = pd.read_csv('/home/sakebow/python/data/germany_energy.csv')
    # 确认索引,并且替换掉原先的索引
    self.all_data.set_index('Date', inplace=True)
    self.date_index = pd.to_datetime(self.all_data.index)
    # 将月份与季度对应起来,并作为新列加入数据集中
    self.all_data['Season'] = self.date_index.month.map(dict(zip(range(1, 13), [1,1,2,2,2,3,3,3,4,4,4,1])))
    pass

  # 直接显示所有数据在同一张表上
  def show_all_data(self):
    self.all_data.plot()
    pyplot.xlabel('date')
    pyplot.show()
    pass
  # 显示2006年的所有数据

  def show_data_in_2006(self):
    self.all_data.loc['2006-01-01' : '2006-12-31']['Consumption'].plot()
    pyplot.title('show data of 2006')
    pyplot.xlabel('date')
    pyplot.show()
    pass
  # 根据季节显示数据

  def show_data_in_season(self, x):
    # 各季节数据
    spring_data = np.array(self.all_data[x].dropna(axis=0, how='all').loc[self.all_data['Season'].isin([2])])
    summer_data = np.array(self.all_data[x].dropna(axis=0, how='all').loc[self.all_data['Season'].isin([3])])
    autumn_data = np.array(self.all_data[x].dropna(axis=0, how='all').loc[self.all_data['Season'].isin([4])])
    winter_data = np.array(self.all_data[x].dropna(axis=0, how='all').loc[self.all_data['Season'].isin([1])])
    # 各季节均值
    spring_mean = np.full(len(spring_data), spring_data.mean())
    summer_mean = np.full(len(summer_data), summer_data.mean())
    autumn_mean = np.full(len(autumn_data), autumn_data.mean())
    winter_mean = np.full(len(winter_data), winter_data.mean())
    # 横坐标范围
    spring_x = np.arange(1, len(spring_data) + 1, 1)
    summer_x = np.arange(1, len(summer_data) + 1, 1)
    autumn_x = np.arange(1, len(autumn_data) + 1, 1)
    winter_x = np.arange(1, len(winter_data) + 1, 1)
    # 分表展示
    spring_figure = pyplot.subplot(221)
    spring_figure.set_title('spring')
    summer_figure = pyplot.subplot(222)
    summer_figure.set_title('summer')
    autumn_figure = pyplot.subplot(223)
    autumn_figure.set_title('autumn')
    winter_figure = pyplot.subplot(224)
    winter_figure.set_title('winter')
    spring_figure.plot(spring_x, spring_data, 'r')
    spring_figure.plot(spring_x, spring_mean, 'g')
    summer_figure.plot(summer_x, summer_data, 'orange')
    summer_figure.plot(summer_x, summer_mean, 'b')
    autumn_figure.plot(autumn_x, autumn_data, 'g')
    autumn_figure.plot(autumn_x, autumn_mean, 'r')
    winter_figure.plot(winter_x, winter_data, 'b')
    winter_figure.plot(winter_x, winter_mean, 'orange')
    # 确认间距
    pyplot.tight_layout()
    pyplot.show()
    pass

  # 显示每周的平均耗电量
  def show_data_in_week(self):
    self.all_data['Weekday'] = self.date_index.weekday
    self.all_data.groupby('Weekday')['Consumption'].mean().plot()
    pyplot.title('show consumption in week')
    pyplot.show()
    pass

  # 根据指定的字段显示数据
  def show_all_data_for_field(self, field):
    self.all_data[field].plot()
    pyplot.title(f'show data for {field}')
    pyplot.show()
    pass

  # 预测模型
  def predict_model(self):
    self.all_wind_data = np.array(self.all_data['Wind+Solar'].dropna(axis=0, how='all')).reshape(-1, 1)
    self.all_consumption_data = self.all_data['Consumption'].loc[self.all_data['Wind+Solar'].dropna(axis=0, how='all').index]
    x_axis = np.arange(1, len(self.all_wind_data) + 1, 1).reshape(-1, 1)
    linear_regression = LinearRegression()
    linear_regression.fit(x_axis, self.all_wind_data)
    return linear_regression.coef_[0][0], linear_regression.intercept_
    pass

  # 预测风力发电
  def predict_wind(self):
    k, b = self.predict_model()
    x_axis = np.arange(1, len(self.all_wind_data) + 1, 1)
    y_axis = list(map(lambda x: k * x + b, x_axis))
    pyplot.scatter(np.arange(1, len(self.all_wind_data) + 1, 1), self.all_wind_data)
    pyplot.plot(x_axis, y_axis, 'r')
    pyplot.plot(x_axis, self.all_consumption_data, 'orange')
    pyplot.plot(x_axis, np.full(len(x_axis), self.all_consumption_data.mean()), 'g')
    pyplot.title('consumption(orange) & wind+solar(blue)')
    pyplot.show()
    pass

  # 闰年检测
  def is_leap_year(self, year):
    if (year % 4 == 0 and year % 100 != 0) or (year % 400 == 0):
      return True
    return False
    pass

  # 天数改为日期
  def days2date(self, days):
    init_year = 2018
    init_month = 1
    while (days > 365):
      if self.is_leap_year(init_year):
        days -= 366
      else:
        days -= 365
        pass
      init_year += 1
      pass
    while (days > 31):
      if init_month in [1, 3, 5, 7, 8, 10,12]:
        days -= 31
      elif init_month in [4, 6, 9, 11]:
        days -= 30
      elif self.is_leap_year(init_year) and init_month == 2:
        days -= 29
      else:
        days -= 28
        pass
      init_month += 1
      if init_month == 13:
        init_month = 1
      pass
    init_date = days
    return init_year, init_month, init_date
    pass
  pass

if __name__ == '__main__':
  ui = QAnalyzeUI('germany energy', qta.icon('fa5s.broadcast-tower', color='red'), CONFIG.WINDOW_WIDTH, CONFIG.WINDOW_HEIGHT, CONFIG.WINDOW_X, CONFIG.WINDOW_Y)
  ui.show()
  sys.exit(CONFIG.app.exec())
  pass
最后
以上就是称心蜜粉最近收集整理的关于用Qt做个简易的数据分析界面导读前期准备优先确认界面(概要设计)确认复用关系(详细设计)开始编码的全部内容,更多相关用Qt做个简易内容请搜索靠谱客的其他文章。


发表评论 取消回复