文章目录
- 简介
- 排查实战
- 排查cpu
- 排查堆内存
- 排查协程
- 排查互斥锁
- 排查阻塞
简介
性能调优原则
- 要依靠数据不是猜测
- 要定位最大瓶颈而不是细枝末节
- 不要过早优化
- 不要过度优化
性能分析工具pprof
pprof是用于可视化和分析性能 分析数据的工具
排查实战
引入 _ "net/http/pprof"
go func() {
    if err := http.ListenAndServe(":6060", nil); err != nil {
        log.Fatal(err)
    }
    os.Exit(0)
}()
浏览器查看http://localhost:6060/debug/pprof
排查cpu
go tool pprof -http=:8080 http://localhost:6060/debug/pprof/cpu
go tool pprof http://localhost:6060/debug/pprof/profile?seconds=10
命令:topN
查看占用资源最多的函数
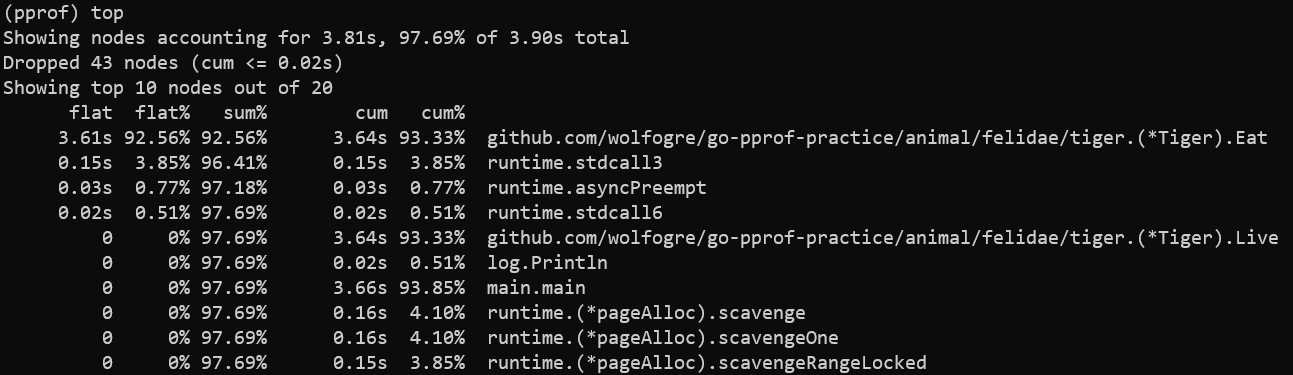
| flat | 当前函数本身的执行耗时 |
|---|---|
| flat% | flat占CPU总时间的比例 |
| sum% | 上面每一行的flat%总和 |
| cum | 指当前函数本身加上其调用函数的总耗时 |
| cum% | cum占CPU总时间的比例 |
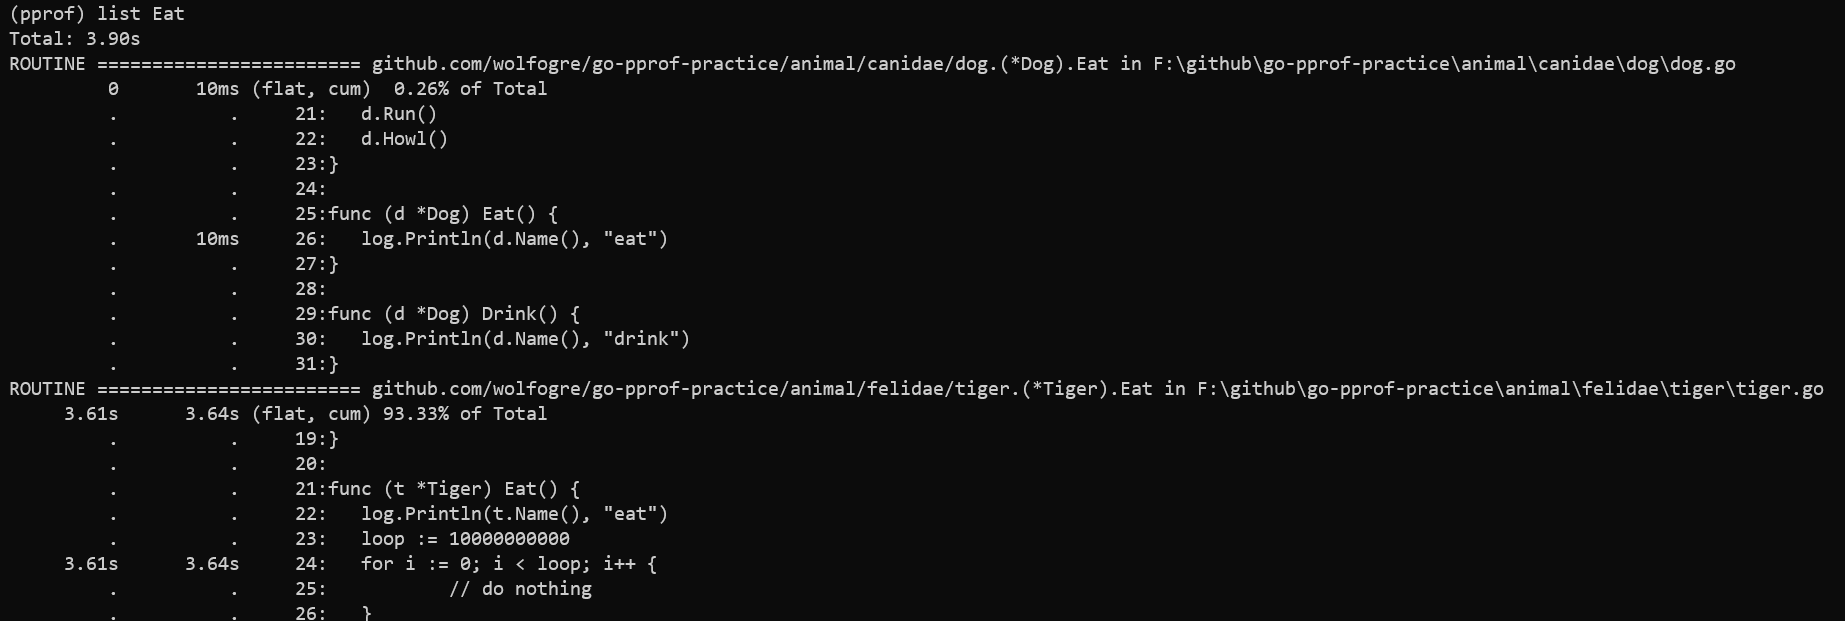
命令:list
根据指定的正则表达式查找代码行
web
调用关系可视化
排查堆内存
go tool pprof http://localhost:6060/debug/pprof/heap
go tool pprof -http=:8080 http://localhost:6060/debug/pprof/heap
排查协程
go tool pprof http://localhost:6060/debug/pprof/goroutine
go tool pprof -http=:8080 http://localhost:6060/debug/pprof/goroutine
排查互斥锁
go tool pprof -http=:8080 http://localhost:6060/debug/pprof/mutex
排查阻塞
go tool pprof -http=:8080 http://localhost:6060/debug/pprof/block
最后
以上就是热心铃铛最近收集整理的关于Go性能调优的全部内容,更多相关Go性能调优内容请搜索靠谱客的其他文章。
本图文内容来源于网友提供,作为学习参考使用,或来自网络收集整理,版权属于原作者所有。


发表评论 取消回复