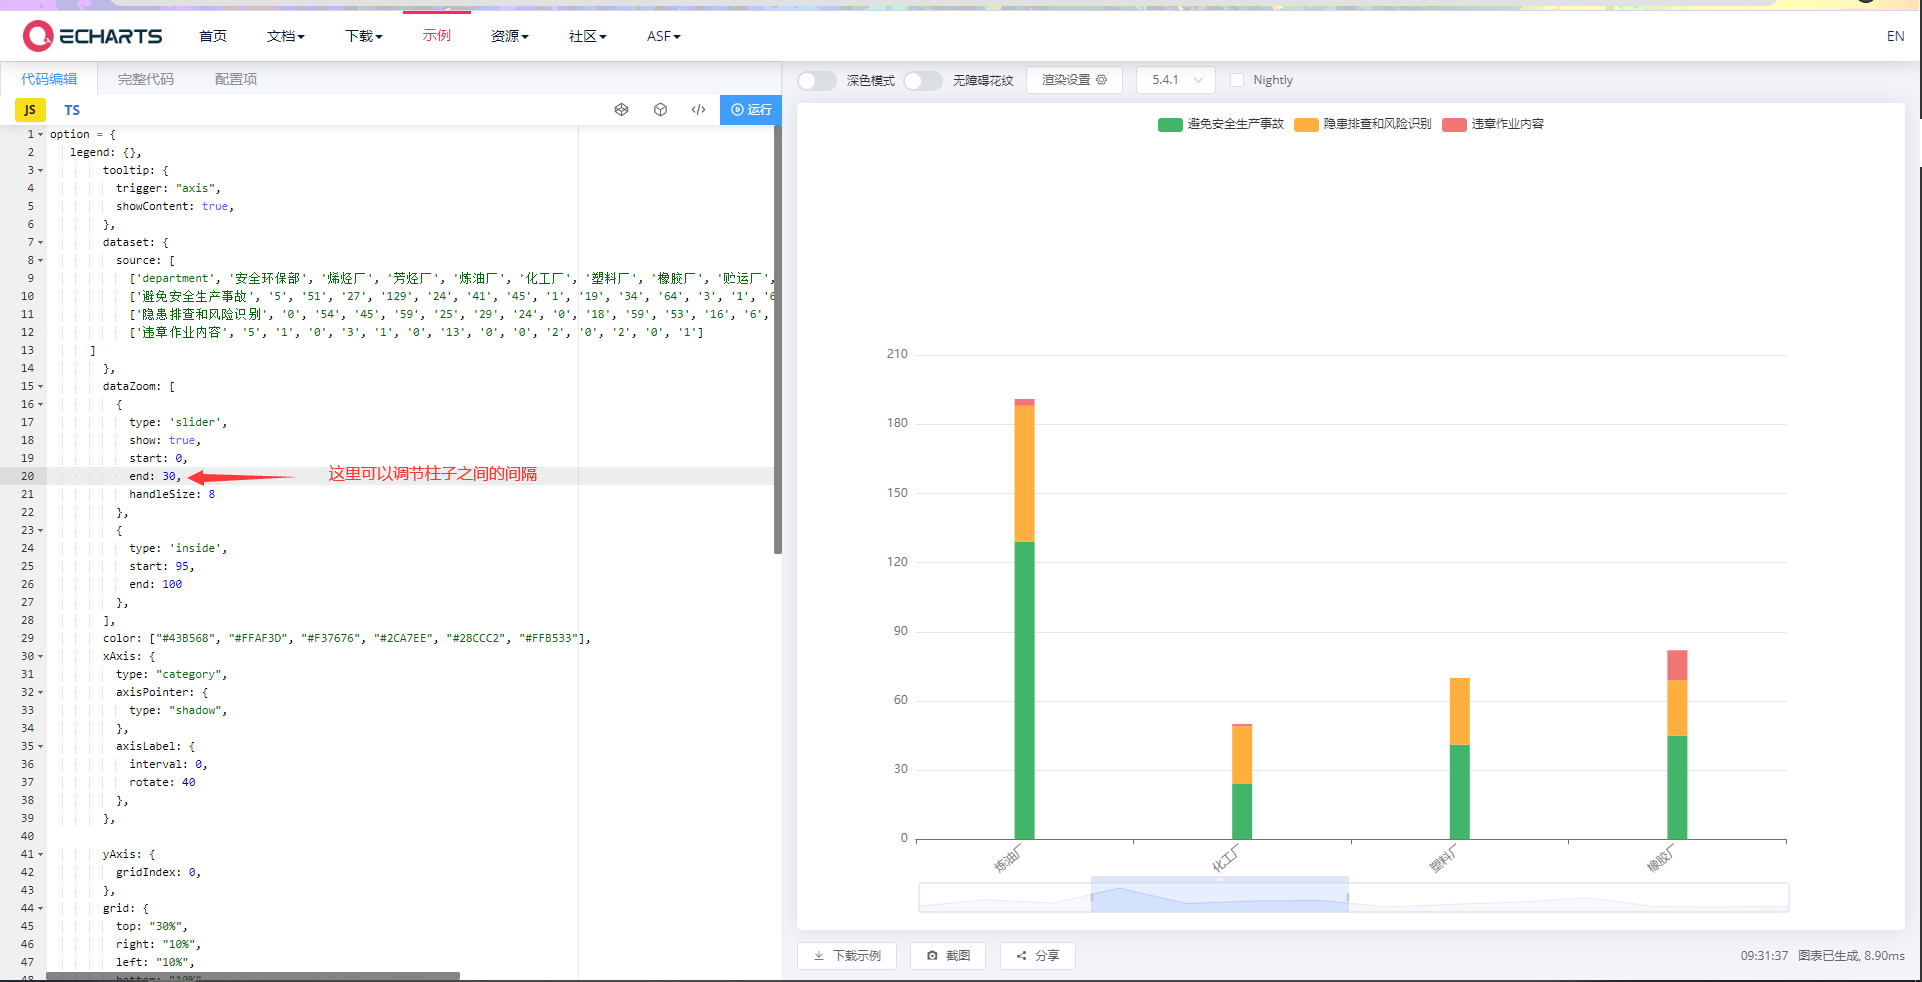
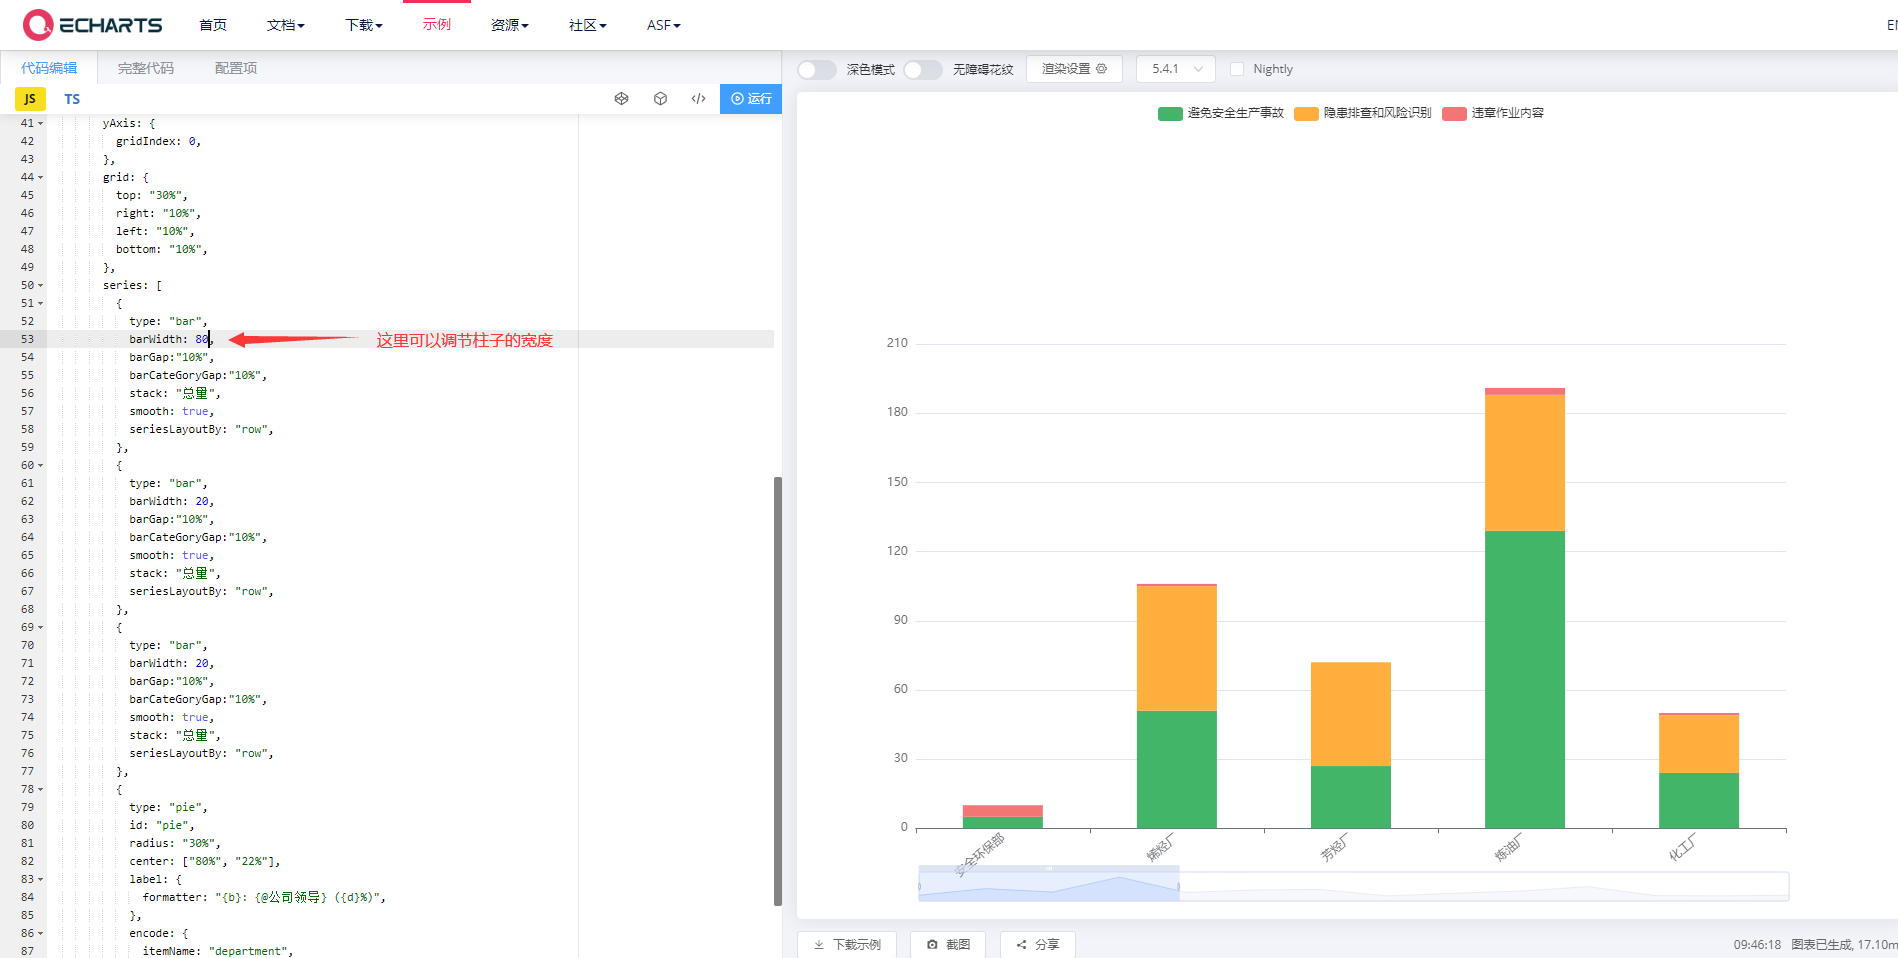
遇到过这种问题记录一下,试了很多方法,最后解决了,每个人遇到的问题不一样
上图:


代码:
option = {
   legend: {},
        tooltip: {
          trigger: "axis",
          showContent: true,
        },
        dataset: {
          source: [
            ['department', '安全环保部', '烯烃厂', '芳烃厂', '炼油厂', '化工厂', '塑料厂', '橡胶厂', '贮运厂', '热电厂', '水厂', '电仪中心', '质检中心', '物采中心', '研究院(精细化工分公司)'],
            ['避免安全生产事故', '5', '51', '27', '129', '24', '41', '45', '1', '19', '34', '64', '3', '1', '6'],
            ['隐患排查和风险识别', '0', '54', '45', '59', '25', '29', '24', '0', '18', '59', '53', '16', '6', '16'],
            ['违章作业内容', '5', '1', '0', '3', '1', '0', '13', '0', '0', '2', '0', '2', '0', '1']
      ]
        },
        dataZoom: [
          {
            type: 'slider',
            show: true,
            start: 0,
            end: 30,     // 改变柱子之间的间隔
            handleSize: 8
          },
          {
            type: 'inside',
            start: 95,
            end: 100
          },
        ],
        color: ["#43B568", "#FFAF3D", "#F37676", "#2CA7EE", "#28CCC2", "#FFB533"],
        xAxis: {
          type: "category",
          axisPointer: {
            type: "shadow",
          },
          axisLabel: {
            interval: 0,
            rotate: 40
          },
        },

        yAxis: {
          gridIndex: 0,
        },
        grid: {
          top: "30%",
          right: "10%",
          left: "10%",
          bottom: "10%",
        },
        series: [
          {
            type: "bar",
            barWidth: 80,     //改变柱子的宽度
            barGap:"10%",
            barCateGoryGap:"10%",
            stack: "总量",
            smooth: true,
            seriesLayoutBy: "row",
          },
          {
            type: "bar",
            barWidth: 20,
            barGap:"10%",
            barCateGoryGap:"10%",
            smooth: true,
            stack: "总量",
            seriesLayoutBy: "row",
          },
          {
            type: "bar",
            barWidth: 20,
            barGap:"10%",
            barCateGoryGap:"10%",
            smooth: true,
            stack: "总量",
            seriesLayoutBy: "row",
          },
          {
            type: "pie",
            id: "pie",
            radius: "30%",
            center: ["80%", "22%"],
            label: {
              formatter: "{b}: {@公司领导} ({d}%)",
            },
            encode: {
              itemName: "department",
              value: "公司领导",
              tooltip: "公司领导",
            },
          },
        ],
};
最后
以上就是暴躁冥王星最近收集整理的关于ECharts图改变参数调节柱子的间隔和柱子宽度的全部内容,更多相关ECharts图改变参数调节柱子内容请搜索靠谱客的其他文章。
本图文内容来源于网友提供,作为学习参考使用,或来自网络收集整理,版权属于原作者所有。


发表评论 取消回复